

SMCI - sideshow until one breaks
Super Micro Computer, Inc. BATS:SMCI
Hi everyone,
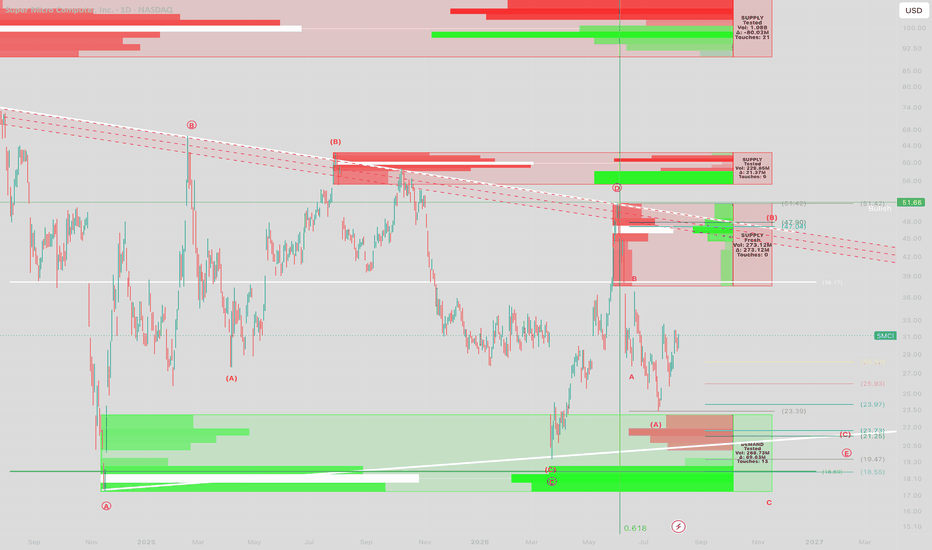
Looking at this chart for a large Wave to finish in a Triangle as all internal waves from the top are in 3 waves -ABC
Final wave E I am tracking 2 options :
1 - It finished and ABC into (A) now I am looking at 47$ for wave (B) then to retest the 22$ lvl for wave (C) to finish E;
- Why 47$ ? There is a huge downtrend line that in the past price reacted to;
- Previous lvl on the fib retrace of 0.887 was respected in the big structure as a B wave;
- Same support of 0.887 Fib Retrace to finish the (c) into E at 22$
- Supply and Demand volum at the 47 and 22$ lvls
Conclusion:
Case 1 , will take profit and wait for the 22$ test - Key on WAIT! As it could brake down…
Case 2 - stock breaks the 49$ pushing higher then retest;
Please comment, judge and be constructive, we all learning!
To mention @Wiseball for his amazing Divergence Indicators - Go Check him out!

