

GOLD FROM SIX WEEK CONSOLIDATION TO WEEKLY BREAKOUT
GOLD FROM SIX WEEK CONSOLIDATION TO WEEKLY BREAKOUT
The preparation for this move started well before the breakout.
We identified the major 3,950 4,000 support zone that gold had defended repeatedly.
We identified the six week daily consolidation.
We identified the 4H descending channel bringing price back into that support.
We then refined the analysis down through the 1H, where bullish order block, imbalance/FVG, trendline and major support were aligning.
The market eventually showed its hand.
Gold respected the 4,000 region.
Then it broke the weekly downtrend.
Then it broke the weekly consolidation.
Then the daily structure followed.
And finally, NFP provided the fundamental catalyst that confirmed the move rather than reversing it.
We are no longer analysing gold as a market trapped inside the old range.
We are analysing gold as a market that has broken out of that range and is now looking for continuation.
1. WEEKLY TIME FRAME THE BIGGEST CHANGE
The weekly chart is where the story becomes very clear.
For weeks, gold was compressing underneath major resistance while repeatedly defending the 3,950–4,000 area.
That created a clear weekly consolidation.
At the same time, price was respecting a descending weekly trendline.
That gave us two pieces of information:
The sellers had structure.
But:
The sellers could not break the major support.
Eventually, the market broke the trendline.
Then it broke the consolidation.
That is much more significant than simply seeing a bullish candle.
We have now seen:
Support defended
→ consolidation
→ weekly trendline break
→ weekly range breakout
→ daily confirmation
→ NFP continuation
This is a genuine change in market structure.
2. THE 4,000 LEVEL WAS THE FOUNDATION
The previous analysis centred around $4,000 for a reason.
For approximately six weeks, the market repeatedly tested the lower region of the range without establishing sustained acceptance beneath it.
That told us something important.
There was demand.
The market could trade below or around 4,000, but sellers could not turn that area into accepted lower-timeframe value.
Instead, price repeatedly returned above it.
This is why the eventual breakout was so important.
The market wasn't breaking higher from nowhere.
It was breaking higher after spending weeks absorbing selling pressure above a major demand zone.
That gives the breakout much more structural weight.

3. THE WEEKLY DOWN-TREND HAS NOW BROKEN
This is one of the biggest developments for the new week.
Previously, the weekly trend was working lower.
Every rally could therefore be viewed as a retracement within a broader bearish structure.
That argument has weakened significantly.
The weekly trendline has now been broken.
But there is an important distinction:
A trendline break is an early warning of a trend change.
A structural breakout and sustained acceptance is stronger.
And that's exactly what we've now started to receive.
Gold didn't simply spike through the weekly trendline and immediately collapse.
It continued higher.
That matters.
4. DAILY TIME FRAME THE PIN BAR THAT COULD HAVE FOOLED PEOPLE
The daily chart gives us another important piece of market psychology.
Thursday produced a bearish pin bar.
For many traders, that candle would have looked like the beginning of a retracement.
The obvious assumption would have been:
Gold has broken out, sellers have appeared, therefore price is going back to reclaim the previous support or fill some of the imbalance created by the breakout.
That would have been a perfectly understandable interpretation.
But it wasn't what happened.
NFP changed the picture.
Instead of allowing the bearish pin bar to develop into a deeper reversal, gold closed the week with a strong bullish engulfing candle.
That is powerful.
Because now the daily sequence becomes:
Breakout
→ bearish rejection
→ failed bearish continuation
→ NFP bullish engulfing
That is a very different structure from:
Breakout → rejection → reversal.
The bears attempted to regain control.
They failed.
Then buyers took control again.
5. THE DAILY CANDLE TELLS US SOMETHING ABOUT POSITIONING
The Thursday bearish pin bar is important precisely because it did not produce the expected follow-through.
A market can become more bullish when bearish price action fails to generate bearish continuation.
That is what we saw.
Traders who sold the pin bar were effectively betting on a return into the old range.
Instead, NFP forced price higher.
This creates a potential trapped-seller dynamic.
And trapped shorts can become fuel for continuation if price continues to make higher highs and higher lows.
This is one reason I don't want to automatically expect a large retracement simply because gold has moved aggressively.
6. NFP WAS THE FUNDAMENTAL CONFIRMATION
The technical breakout was already developing.
NFP then provided the catalyst.
The July employment report was substantially weaker than markets wanted to see, and financial markets subsequently reduced expectations for a September Fed hike. The dollar also weakened following the report.
That is exactly the macro relationship we were watching going into NFP:
Weak labour data
↓
Less pressure for tighter monetary policy
↓
Lower rate expectations
↓
Dollar weakness / lower yields
↓
Gold strength
The key point is that NFP didn't create a completely random move.
It aligned with the technical structure that had already been building.
7. THE FUNDAMENTAL STORY HAS NOW SHIFTED
This is important for the new week.
Previously, we had conflicting forces.
Gold had geopolitical support, but the Fed/yield environment was creating a significant headwind.
Now the labour market has provided evidence that the economy may be losing momentum.
That has altered the rate narrative.
Reuters reported that the weak July employment data caused markets to reduce the probability of a September Fed hike, although economists continued to point out that there remains a case for tightening.
So we still don't have a completely dovish Federal Reserve.
But the market has started questioning how aggressive the Fed really needs to be.
For gold, that matters enormously.
8. THE NEXT FUNDAMENTAL TEST INFLATION
The new week is different from the previous one.
We are no longer waiting for NFP.
NFP has happened.
Now the market has to decide whether the weak employment data is enough to sustain the new gold trend.
The next major test is inflation.
US CPI is scheduled for Wednesday, followed by PPI Thursday, while retail sales also arrive during the week.
This gives us an important fundamental sequence:
Last week
Employment
↓
Fed expectations changed
↓
Gold breakout
This week
Inflation
↓
Will the Fed actually have room to ease?
↓
Will yields remain suppressed?
↓
Can gold continue higher?
That is the macro question.
9. THE BULLISH FUNDAMENTAL SCENARIO
The best environment for gold would be:
Weak employment
Cooling inflation
Lower yields
Weaker dollar
That would strengthen the argument that the Fed's tightening bias is becoming less necessary.
And if that happens while gold is already sitting above a major weekly breakout?
That creates a powerful combination.
Technical structure says:
Buyers have taken control.
Fundamentals say:
The environment is becoming less hostile.
That is when continuation can accelerate.
10. THE BEARISH FUNDAMENTAL SCENARIO
The biggest threat to this bullish structure would be:
Hot CPI
or
Hot core inflation
particularly if the market interprets it as evidence that the Fed cannot afford to ease.
Then:
Inflation ↑
↓
Rate expectations ↑
↓
Yields ↑
↓
Dollar ↑
↓
Gold comes under pressure.
But again, we don't automatically short.
The fundamental change would need to be reflected in price.
11. THE 4H TIME FRAME — WHERE WE LOOK FOR THE TRADE
This is where the analysis becomes actionable.
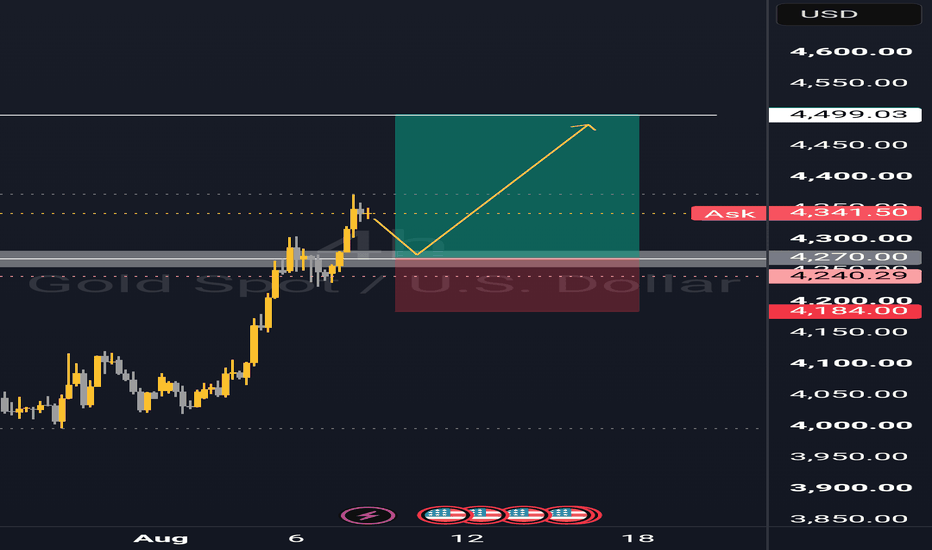
We have identified a previous support level around 4,270.
This is extremely important.
Why?
Because this level has already demonstrated that it can support gold.
It has produced multiple reactions.
Now we have additional confluence.
4,270
Previous support
4H structure
Trendline
Broken resistance trendline
Previous breakout structure
This is exactly the type of area we want to mark before the market reaches it.
12. 4,270 IS NOT JUST A NUMBER
The reason I like 4,270 is not because the number itself is magical.
It's because of what sits around it.
We have a previous support zone that has repeatedly generated reactions.
We have a trendline adding confluence.
And we have a broken resistance trendline.
That creates a potential support cluster.
The market has essentially changed the role of this area.
Previously:
Resistance / structural obstacle
Now:
Potential support for continuation.
That is classic market structure.
13. THE 4H BULLISH CONTINUATION MODEL
The primary setup for the new week is:
$4270 AOI
We allow gold to retrace.
Then we observe.
I don't want to blindly buy the first touch.
I want to see whether buyers actually defend it.
The ideal sequence is:
Price enters $4,270
↓
Liquidity sweep
↓
Bullish rejection
↓
LTF displacement
↓
Bullish CHOCH/BOS
↓
FVG/OB created
↓
Retest
↓
Long
This keeps the same philosophy we've used throughout the previous analysis:
Location first.
Confirmation second.
Execution third.
14. WHY I DON'T WANT TO CHASE GOLD
Gold has already moved aggressively.
That means buying at the top of an expansion candle can produce poor risk/reward.
The market doesn't owe us an immediate retracement.
But if one comes, we already know where we want to pay attention.
That's the advantage of doing the analysis beforehand.
We don't need to chase.
We have the level.
We wait for price to come to us.
15. PRIMARY UPSIDE OBJECTIVE 4,500
Your next major objective is 4,500.
This makes sense both technically and psychologically.
The market has broken out of the previous consolidation.
A measured move from the old range points toward the 4,470–4,480 area, where the 200-day moving average was also previously located.
That means the region around:
4,470–4,500
becomes an important higher-timeframe objective.
Rather than treating 4500 as a guaranteed destination, I would treat it as the first major area where the market must prove itself again.
16. THE ROAD FROM 4,270 TO 4,500
I would divide the move into stages.
4,270
Primary continuation AOI.
4,300
First psychological checkpoint.
4,350
Intermediate resistance / liquidity.
4,400
Major psychological level.
4,470–$4,480
Measured move + major moving-average area.
4,500
Major psychological target.
This gives us a much cleaner way of managing the move rather than simply saying:
“Buy 4,270 and hold until 4,500.”
The market needs to earn each level.
17. WHAT IF 4,270 DOESN'T HOLD?
This is equally important.
The bullish thesis is not:
“Gold must go up.”
The thesis is:
“Gold has broken higher and we want to buy continuation while the breakout structure remains intact.”
If 4,270 breaks, we reassess.
A deeper retracement could bring price toward:
4225
then:
4180
These are extremely important because they were the previous six-week range highs.
Remember:
Old resistance becomes new support.
Therefore, a deeper pullback into 4,180–4,225 does not automatically make us bearish.
It could actually provide another high-quality continuation opportunity.
18. THE BIG STRUCTURAL LINE 4,180
This is the level I would consider the major dividing line for the new weekly structure.
Above:
Bullish breakout structure.
Below:
The breakout is being questioned.
A wick below 4,180 is not enough.
I want to see acceptance.
If gold begins closing daily candles back below 4,180, then we have to entertain the possibility that the breakout was a false expansion.
But until that happens, I don't want to fight the higher-timeframe structure.
19. THE OLD RANGE LOW — 3,955–4,000
This remains on the chart.
We don't delete levels simply because price has moved away from them.
The 3,955–4,000 region remains the major weekly demand zone.
It was the foundation of the entire six-week structure.
If gold eventually returns there, the market will be telling us something very different.
But for the current week, that is not the primary scenario.
The market has moved away from the lower boundary and broken the upper boundary.
The immediate job is to determine whether the breakout holds.
20. THE OLD 4H CHANNEL
Another important point from the original analysis:
Gold was previously travelling down through a descending 4H channel toward major support.
That channel was useful because it explained the path price took into the demand zone.
Now the market has broken out of that bearish corrective structure.
This is important because the old channel was essentially describing the correction.
The breakout tells us that correction may now be complete.
We therefore move from:
Selling into support
to:
Buying retracements after the structural breakout.
21. THE BROKEN RESISTANCE TRENDLINE
The additional trendline identified gives us another layer of confluence.
When resistance is broken, it shouldn't simply disappear from the chart.
We ask:
What happens when price comes back to it?
If that broken trendline aligns with the 4,270 support region, we have another reason to monitor the area.
The more independent reasons we have for a reaction, the more interesting the AOI becomes.
But remember:
Confluence identifies the location.
Price action confirms the trade.
22. MARKET PSYCHOLOGY
This week's setup is particularly interesting because of the traders who are now positioned incorrectly.
Before the breakout, many traders were waiting for $4,000 to fail.
Then gold broke higher.
Others sold the first rejection.
Then Thursday produced the bearish pin bar.
Then NFP squeezed higher.
Now there are potentially:
• Traders trapped short
• Traders chasing longs
• Traders waiting for a retracement
• Traders who missed the breakout
That creates a very emotional market.
And emotional markets create liquidity.
This is why I don't want to predict the next candle.
I want to identify where liquidity is likely to be taken and then watch how price reacts.
23. WHAT I EXPECT FROM THE WEEK
I don't necessarily expect gold to move vertically from 4,300 to 4,500 without interruption.
A healthy bullish market can:
breakout → retrace → build → continue.
In fact, a controlled retracement would be constructive.
The thing I don't want to see is:
breakout → complete collapse back into the old range.
That's the difference between continuation and failure.
24. MY PRIMARY WEEKLY PLAN
🟢 BULLISH CONTINUATION
Watch:
$4,270
If price reaches the zone:
Wait for:
liquidity sweep
→ bullish displacement
→ LTF BOS/CHOCH
→ FVG/OB retest
→ long
Targets:
4,300
4,350
4,400
4,470–4,480
4,500
25. DEEPER BULLISH RETRACEMENT
If gold doesn't respect 4,270:
Don't immediately turn bearish.
Watch:
4,225–4,180
This is arguably an even more important higher-timeframe support region because it represents the old six-week range ceiling.
If that area holds:
old resistance → new support
and the bullish continuation thesis remains valid.
26. BEARISH FAILURE SCENARIO
The bearish scenario requires evidence.
I would want to see:
4,180 break
↓
daily acceptance beneath
↓
retest from underneath
↓
bearish rejection
↓
continuation lower.
Then we can start looking toward:
4,100
4,000
3,955
At that point, the weekly breakout would be considered failed.
Until then, selling into every retracement would be fighting the structure.
27. FUNDAMENTAL CHECKLIST FOR THE WEEK
The most important events are now inflation-related.
Wednesday — CPI
This is the first major test of the post-NFP gold rally.
Watch:
Headline CPI
Core CPI
Monthly changes
and most importantly:
the reaction in Treasury yields and the dollar.
A softer-than-expected inflation report would reinforce the post-NFP rate narrative.
A hotter report would challenge it.
Thursday — PPI
PPI provides another read on underlying price pressures.
If CPI and PPI tell the same story, the Fed narrative becomes much clearer.
Retail Sales
Consumer spending will help determine whether the US economy is actually slowing or simply experiencing a temporary labour-market shock.
The week therefore becomes a battle between:
Growth weakening
and
Inflation remaining sticky.
That is the fundamental battle underneath gold.
28. THE DOLLAR AND YIELDS ARE OUR MACRO CONFIRMATION
For this particular setup, I would keep DXY and Treasury yields on the screen.
The technical gold breakout is important.
But if gold is going to continue toward 4,500, I want the macro environment to support it.
The ideal combination is:
DXY ↓
Treasury yields ↓
Gold ↑
If gold starts falling while yields and DXY rise sharply after inflation data, that's a warning that the market is repricing the Fed.
The price action at 4,270/4,225 then becomes even more important.
29. GEOPOLITICS REMAINS A WILDCARD
The Hormuz situation remains relevant.
But one of the most constructive aspects of last week's rally was that gold was able to strengthen even as the geopolitical premium was being reduced.
That suggests the market is increasingly responding to monetary conditions rather than needing a geopolitical crisis to justify higher prices.
That is healthier for the bullish thesis.
However, any sudden escalation could add another layer of safe-haven demand.
So geopolitics remains a catalyst not the primary reason for the trade.
30. THE COMPLETE MULTI-TIMEFRAME STORY
WEEKLY
Major 3,955–4,000 support defended.
Weekly downtrend broken.
Weekly consolidation broken.
Bullish structural change.
DAILY
Breakout confirmed.
Thursday bearish pin bar failed to produce downside continuation.
NFP produced strong bullish engulfing.
Buyers regained control.
4H
Previous support around 4,270 remains important.
Trendline confluence.
Broken resistance trendline.
Potential continuation AOI.
1H / LTF
This is where we execute.
We wait for:
Sweep → displacement → structure break → retest.
FUNDAMENTALS
Weak NFP reduced Fed tightening expectations.
Dollar weakened.
Rate narrative has become more supportive for gold.
Next major test:
CPI → PPI → Retail Sales.
31. THE BIGGER TARGET
The old six-week range measured roughly 245–270 points depending on the exact boundaries used.
Projecting that range higher puts the measured objective around:
4,470–4,500.
And that is particularly interesting because the 200-day moving average was previously around the 4,480 area.
So we have multiple pieces of analysis converging:
Range projection
200-day moving average
psychological 4,500
=
MAJOR OBJECTIVE: 4,470–4,500
That is where I expect the market to have a meaningful conversation.
32. WHAT WOULD MAKE ME EVEN MORE BULLISH?
A successful retest of 4,270.
Then:
higher low
→ break 4,350
→ acceptance above 4,400
→ approach 4,470–4,500.
If gold then breaks and accepts above 4,500, the argument becomes much larger.
At that point, we're no longer simply trading a measured move from a six-week range.
We would be looking at the possibility that the entire 2026 corrective structure is changing.
FINAL WEEKLY BIAS
Weekly:
Bullish
Daily:
Bullish
4H:
Bullish continuation
1H:
Wait for retracement and confirmation
Fundamental:
Improving for gold following the weak labour report, but inflation data is the next test.
THE PLAN
The market has already given us the breakout.
We don't need to prove that it happened.
We don't need to chase it.
We now need to see whether the market can hold what it broke.
The primary area I'm interested in is:
4,270
Previous support.
Trendline confluence.
Broken resistance trendline.
Potential continuation zone.
If price reaches it and gives us:
liquidity sweep → bullish displacement → BOS/CHOCH → FVG/OB retest
then the continuation trade becomes interesting.
The first objectives are:
4,300 → 4,350 → 4,400
with the larger objective:
4,470–4,500
If 4,270 doesn't hold, we don't panic and flip bearish.
We look deeper.
4,225–4,180 is the major breakout-retest region.
If that holds, the bullish structure remains intact.
The level that changes the conversation is 4,180.
A sustained daily acceptance beneath it would tell us the breakout is being challenged.
Until then, the higher-timeframe evidence is pointing in one direction:
Gold has transitioned from defending the bottom of a six-week range to defending the breakout above the top of that range.
And that is the key difference going into this new week.
We don't predict.
We prepare the levels.
We wait for price to come to them.
Then we let price action tell us whether the buyers are still in control.
