Saudi Kayan : Reclaim the Long-Term Trend? 🇸🇦
 2350
2350
📈 Weekly Reversal Taking Shape — Can Buyers Reclaim the Long-Term Trend? 🇸🇦
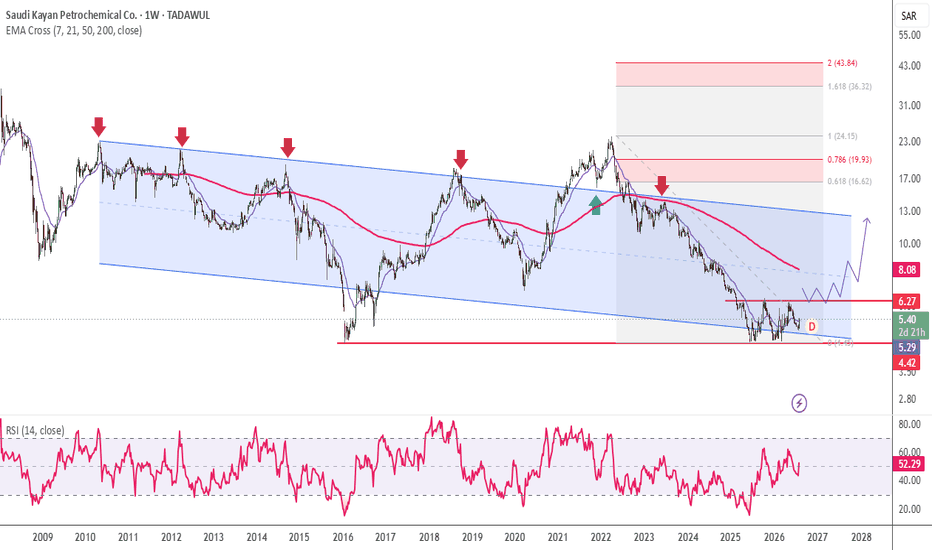
After a prolonged decline, the stock is beginning to show early signs of a weekly trend reversal, rebounding strongly from the 4.40 support zone.
While the recovery is still in its early stages, the technical picture is becoming increasingly constructive as buyers gradually regain control.
🔍 Technical Outlook
The bullish case is supported by multiple technical signals:
✅ Bullish divergence suggests downside momentum is fading.
✅ Price has formed a Higher Low (HL) around 4.90, indicating the first signs of a bullish market structure.
✅ Weekly price action continues to improve, keeping the reversal thesis intact.
Although these are encouraging developments, confirmation remains the key.
🚀 Breakout Level to Watch
The 6.30–6.40 resistance zone is the first major hurdle.
A sustained breakout and close above this range would signal growing buyer confidence and strengthen the probability of a continued rally.
If bulls successfully reclaim this level, the next upside targets are:
🎯 Target 1: 8.00
🎯 Target 2: 11.00
🎯 Target 3: 13.00
🎯 Extended Target: 16.60, aligning with the 0.618 Fibonacci retracement level.
⚠️ Weekly 200 EMA: The Make-or-Break Zone
One of the most important technical levels on the chart is the Weekly 200 EMA, currently positioned around 8.00.
This dynamic resistance is likely to determine whether the current recovery evolves into a sustained long-term uptrend or faces temporary selling pressure.
A decisive breakout above the Weekly 200 EMA, supported by strong volume and bullish weekly candles, would significantly strengthen the long-term outlook.
📊 My View
The chart is beginning to transition from accumulation to recovery, but the market still needs confirmation before a high-conviction entry.
📈 Bullish Signals:
Rebound from 4.40 support.
Bullish divergence on the weekly chart.
Formation of a Higher Low at 4.90.
👀 Key Confirmation Levels:
6.30–6.40: Initial breakout trigger.
8.00 (Weekly EMA200): Major trend confirmation.
🚀 Bullish Targets: 8.00 → 11.00 → 13.00 → 16.60
Rather than trying to predict the move, let the market confirm the breakout. Strong trends are built on confirmation—not anticipation.
Do you think this is the beginning of a long-term reversal, or will the Weekly 200 EMA prove to be a tough barrier? Share your technical view below! 👇
⚠️ Financial Disclaimer
Disclaimer: This analysis is shared for educational and informational purposes only and should not be considered financial, investment, or trading advice. Always conduct your own research (DYOR) and apply appropriate risk management before making investment decisions.
#Tadawul #SaudiStockMarket #SaudiStocks #TASI #SaudiInvesting #SaudiTrading #SaudiInvestors #KSAStocks #SaudiEquities #MiddleEastMarkets #GCCMarkets
#TechnicalAnalysis #TradingView #PriceAction #WeeklyChart #MarketStructure #TrendReversal #BullishDivergence #HigherLow #EMA200 #Fibonacci #Breakout #SupportAndResistance #SwingTrading #TrendFollowing #MomentumTrading #ChartAnalysis #TradingIdeas #StockAnalysis #BullishSetup #RiskManagement #WiSHFundManagement