OIL INDIA — GOLDEN RATIO AT A CRITICAL DECISION ZONE
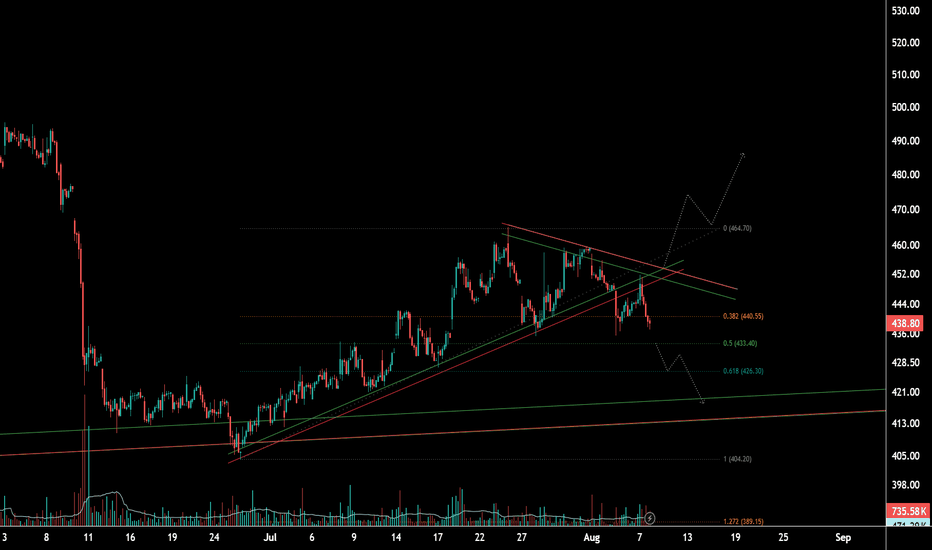
Oil India – Key Technical Setup
Oil India is currently trading within its Fibonacci golden-ratio zone between the 0.5 and 0.382 levels, roughly ₹430–₹441. Despite giving a trendline breakdown, the stock is still respecting this important Fibonacci support zone.
At present, the structure remains range-bound, and the next major move will depend on which side the stock breaks.
Bullish Scenario:
If Oil India manages to reclaim and break above the upper trendline, the Fibonacci zone will continue to hold, opening the possibility of an upside move toward ₹485–₹490.
Bearish Scenario:
If the stock breaks decisively below ₹430, it would confirm a breakdown of both the trendline structure and the key Fibonacci support zone. This could accelerate the downside momentum, with the next major support coming around ₹410–₹412.
Key Levels:
• Fibonacci Support Zone: ₹430–₹441
• Breakout Trigger: Upper Trendline
• Upside Targets: ₹485–₹490
• Breakdown Below ₹430: Bearish Confirmation