
SOLUSDT idea
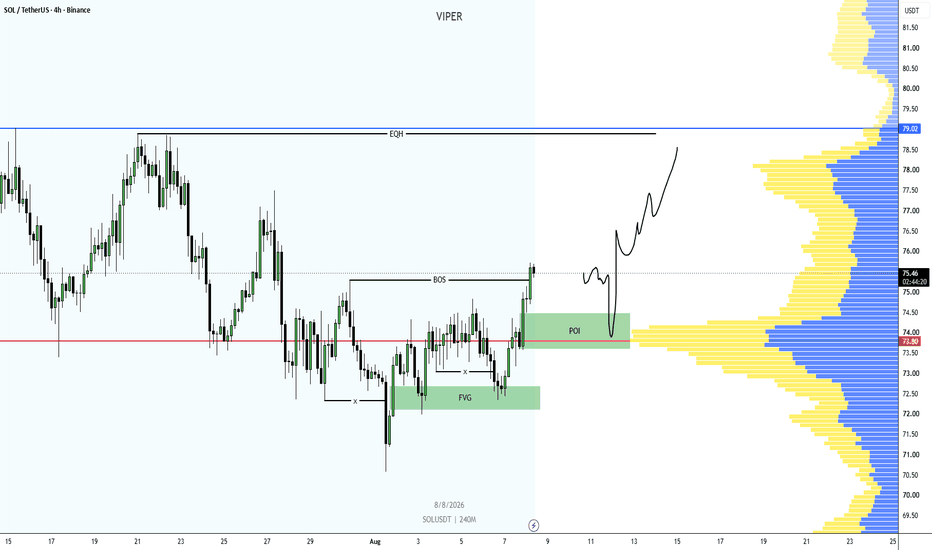
SOL/USDT 4H — The Setup Is Building, But Patience Is Key
SOL/USDT is currently sitting at a very interesting area on the 4H timeframe.
After a prolonged period of consolidation and several liquidity sweeps below the range, price has finally started showing signs of strength and has reclaimed an important structural level. The current price is around 75.44, while the major level I am watching below is 73.80.
For me, this is not simply a matter of “SOL goes up from here.”
The more interesting question is:
Can price successfully retest the newly reclaimed structure, hold the POI, and then expand toward the liquidity resting above?
That is where the setup becomes much more interesting.
🔹 Market Structure
Looking at the recent price action, SOL spent a significant amount of time ranging between approximately 72–75+.
During this consolidation, we can see multiple attempts to move lower, including a deeper liquidity sweep around the 71–72 area.
Instead of continuing lower, price aggressively recovered from that region and began forming a series of higher lows.
This is important because the sell-side liquidity below the range appears to have already been taken.
After that liquidity event, price returned back into the range and eventually pushed through the short-term resistance around the 75 area.
The chart currently shows a BOS — Break of Structure around the 75.3–75.4 region.
A successful break of structure is not enough by itself for me to consider the move confirmed.
I want to see what happens on the retest.
🔹 The Main Area I Am Watching: 73.80
The 73.80 level is extremely important for this setup.
This level is acting as a major reference point between the previous consolidation and the current bullish attempt.
There is also a green POI (Point of Interest) zone sitting roughly between 73.8 and 74.5.
This is the area where I would expect buyers to potentially defend price if the bullish structure is genuine.
The ideal scenario would therefore be:
Price expands higher → takes liquidity / creates displacement → retraces back toward the POI → holds the zone → continues higher.
I do not want to chase the initial move.
If SOL runs directly toward 77–78 without giving a proper retracement, the risk/reward becomes significantly less attractive.
The better opportunity would come from allowing price to return into the area of interest.
🔹 Why 73.80 Matters
There are several reasons why I am paying attention to this region.
First, it represents the lower boundary of the current POI.
Second, it is closely connected to the recent consolidation structure.
Third, the volume profile on the right side of the chart shows significant activity around the 73.5–74.5 region.
That means this area has seen a lot of transactions.
When price returns to a high-volume area after a structural breakout, the reaction can be very informative.
If buyers step in and defend the zone, it would strengthen the bullish thesis.
However, if price loses this area with strong bearish displacement and cannot reclaim it, then the current bullish setup becomes much weaker.
So I would not treat 73.80 as a magical number.
I would treat it as a decision zone.
🔹 The FVG Below
Another interesting component on the chart is the Fair Value Gap (FVG) around the 72.2–72.7 area.
This gives us another potential destination if price performs a deeper retracement.
The market does not always respect the first POI.
Sometimes price will:
Break structure.
Retrace into the first POI.
Fail to find enough liquidity.
Continue deeper into an FVG.
Take liquidity.
Reverse aggressively.
That is why I am not interested in entering simply because price touches 74.
I want to see how price behaves inside the zone.
If SOL dips into the POI and immediately gets rejected with strong bullish displacement, that would be much more interesting than blindly placing a limit order.
🔹 The Liquidity Above
Now we get to the more interesting part.
Above the current price, there is a very clear area of liquidity.
The first major objective is around 77–78.
The larger reference is the EQH (Equal Highs) around 79.02.
Equal highs are important because they represent a very obvious liquidity pool.
A lot of traders will naturally place their stops above these highs.
That creates a potential target for price.
So if the bullish structure continues, I would expect the market to potentially gravitate toward:
75.5 → 76.5 → 77.5 → 78.0 → 79.02
The exact path obviously cannot be predicted.
Price could move aggressively, consolidate, retrace, or create another liquidity sweep before reaching the highs.
But structurally, the liquidity above is very attractive.
🔹 79.02 — The Bigger Target
The 79.02 EQH is probably the most obvious upside target on this chart.
This is where the previous highs are sitting, and therefore it represents a clear pool of buy-side liquidity.
If SOL manages to reclaim and hold above the current BOS, then a move toward those equal highs becomes increasingly logical.
But there is an important distinction:
Target ≠ guaranteed reversal.
I am not assuming that SOL will reverse immediately at 79.02.
The market could sweep 79.02 and continue higher.
Alternatively, it could run into the level, reject aggressively, and begin a larger reversal.
The reaction around that liquidity will tell us much more than the level itself.
🔹 Volume Profile Confirmation
The volume profile on the right side of the chart also gives us some useful information.
There is significant volume concentrated around the 73.5–74.5 region, which aligns very nicely with the POI.
This is one of the reasons the zone is interesting.
Below that, there is another important concentration of volume around the 71–72.5 area.
Above the current price, volume distribution becomes more interesting around 76–78.
This creates a potential roadmap:
Support / Decision Zone
73.8–74.5
Deeper Support / FVG
72.2–72.7
Current Breakout Area
75.3–75.5
Intermediate Liquidity
76.5–78.0
Major Liquidity
79.02 EQH
Again, these are not predictions of exact price movement.
They are simply the levels where I would expect the market to potentially react.
🔹 My Bullish Scenario
The bullish scenario is relatively straightforward.
I would like to see SOL remain above the recent structural breakout and ideally come back to test the POI.
Something like:
BOS → retracement → POI reaction → higher low → continuation
If price comes into the 73.8–74.5 region and buyers show clear strength, the setup becomes much more attractive.
The first objective would be a return toward the current highs around 75.5–76.
After that, I would watch the 77–78 area.
If momentum remains strong, the ultimate liquidity target becomes the 79.02 EQH.
A clean reclaim of 79.02 could then open the door for a larger continuation.
🔹 What I Don't Want To See
The bearish invalidation scenario is equally important.
If SOL loses the 73.80 area with strong displacement and fails to reclaim it, I would become much more cautious.
A move below the POI could mean that the breakout was simply a liquidity grab rather than a genuine structural reversal.
In that case, the next area I would pay attention to is the 72.2–72.7 FVG.
And if that area also fails, the market could potentially revisit the lower liquidity around 71–72.
This is why I don't believe in forcing a directional bias.
The market will tell us.
🔹 The Ideal Trade Psychology
One of the biggest mistakes traders make in setups like this is chasing the breakout candle.
SOL has already moved away from the lower part of the range.
Entering after an extended move can create poor risk/reward, especially when there is a clearly defined POI below.
For me, the better approach is:
Let price come to you.
If the market retraces into the POI and gives confirmation, there may be an opportunity.
If it never retraces and simply moves toward 79, that's okay too.
Missing a trade is better than forcing a bad trade.
There will always be another setup.
🔹 What I Am Watching Next
For the next few 4H candles, I am mainly watching four things:
1️⃣ Does SOL hold the BOS?
The recent break around the 75 area needs to remain meaningful.
If price immediately loses the breakout, the bullish thesis weakens.
2️⃣ Does price return to the POI?
A controlled retracement into 73.8–74.5 would be very interesting.
3️⃣ How does price react there?
This is probably the most important part.
I want to see whether buyers actually defend the zone.
4️⃣ What happens near 77–79?
If SOL reaches the upper liquidity, I will be watching for either continuation or a potential liquidity sweep/reversal.
🔹 Overall Bias
At the moment, my bias is cautiously bullish while price remains above the important structural area.
I am not saying that SOL must go straight to 79.
Markets rarely move in a straight line.
The cleaner idea is:
Bullish structure → retracement into POI → confirmation → continuation toward buy-side liquidity.
The key level for me remains 73.80.
Above that area, I am interested in bullish continuation.
Below it, I would start considering the possibility of a deeper retracement toward the 72.2–72.7 FVG and potentially the lower liquidity.
🔥 Final Thoughts
SOL is currently at an interesting point in its 4H structure.
We have:
✅ Liquidity taken below the previous range
✅ Strong recovery from the lower area
✅ Higher-low development
✅ Break of structure
✅ POI around 73.8–74.5
✅ FVG around 72.2–72.7
✅ Significant volume around the POI
✅ Buy-side liquidity above
✅ EQH around 79.02
The chart is essentially giving us a roadmap.
The question is not whether we can predict every candle.
We can't.
The goal is to identify where the market is likely to make a meaningful decision and then react accordingly.
For me, that decision zone is the 73.8–74.5 POI.
If buyers defend that area and SOL continues to build bullish structure, the next major magnet is the liquidity sitting around 77–79, with 79.02 EQH being the key level to watch.
If the POI fails, I will not try to force the bullish narrative.
I would rather wait for the market to reach the next important area and reassess.
Patience > prediction.
Wait for the retracement.
Wait for confirmation.
Then let the market do the work.
Not financial advice. This is simply my technical analysis and the way I am reading the current SOL/USDT 4H structure.
