NVIDIA (NVDA) Technical Analysis: Elliott Wave and Support Level
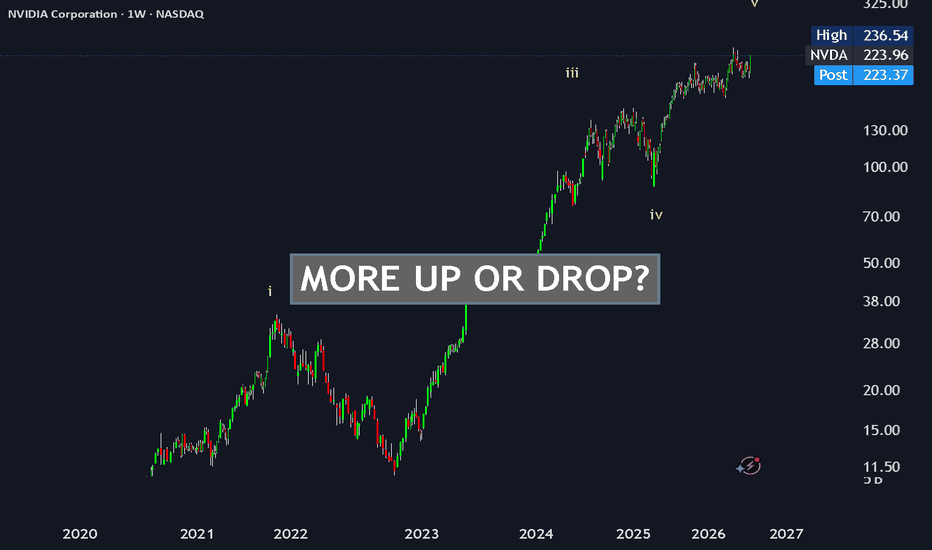
NVIDIA (NVDA) remains in a strong long-term uptrend, but my current Elliott Wave count places the structure in a late stage.
On the monthly chart, I look at the larger market structure, the long-term rising channel, and the higher-degree Elliott Wave count. I then move to the weekly chart to look more closely at the current fifth wave and the possible scenarios from here.
My working count places NVDA in wave five inside the larger wave three, with the final smaller fifth subwave potentially developing now. The current fifth wave may still extend higher, or the larger correction may begin from this area.
For the correction, I am monitoring several major Volume Profile support zones:
$165–200
$90–150
$40–50
$15–30
The first area is the one I am watching now. If price holds this zone and moves higher, the fifth-wave extension scenario remains active. If price breaks the zone and stays below it, the next lower support area becomes more relevant.
This is a technical scenario map based on Elliott Wave, market structure, the long-term price channel, and Volume Profile. I will update the analysis as new price action develops.