
NVDA breakout Attempt? Key Confluences & Targets to Watch
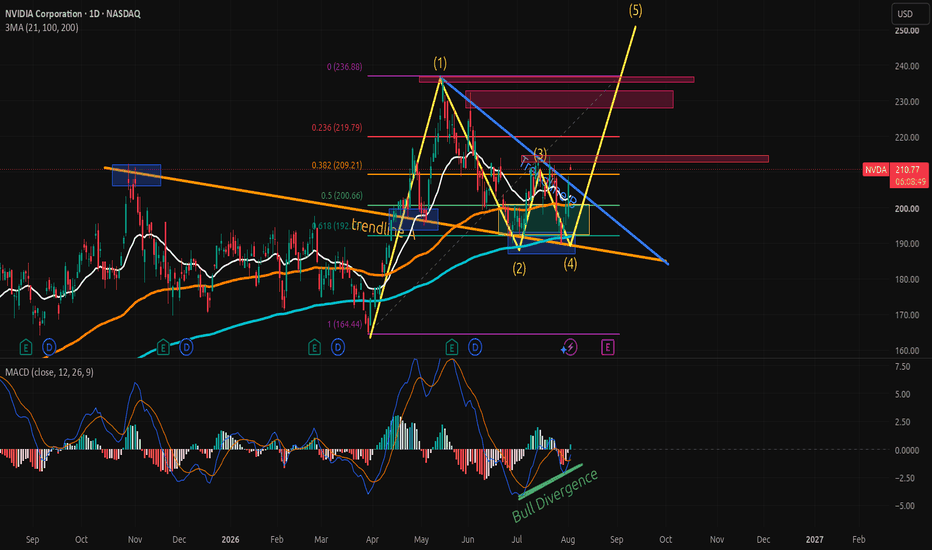
NVDA breakout Attempt? 🚀 Key Confluences & Targets to Watch
🧠 Fundamental Overview:
Nvidia (NASDAQ: NVDA) continues to dominate the artificial intelligence narrative. Recently, CEO Jensen Huang highlighted that the semiconductor industry might need to expand to a staggering $7.9 trillion to support the impending "agentic AI" boom, a transition further fueled by the rollout of their new Vera Rubin architecture. Additionally, Nvidia is taking unprecedented steps to act as a financier for the next wave of AI infrastructure, expanding its massive ecosystem far beyond hardware. However, despite these strong macro and technological tailwinds, caution is strictly warranted. Nvidia is scheduled to present its earnings report on August 26, 2026, an event that typically introduces significant market volatility.

📊 Technical & Quant Analysis (1D Timeframe):
Opening today, August 4, the price is aggressively attempting to break out of a descending triangle that has constrained price action since May. Looking closely at the chart, we can identify a beautiful confluence of technical and quantitative factors that strongly suggest a bullish setup:
1️⃣ Double Bottom & Trendline Confluence: We are coming directly off a textbook double bottom (highlighted by the blue boxes) around the $192–$194 level. This structurally aligns perfectly with ascending Trendline A, providing a highly robust floor for the asset.
2️⃣ The Golden Ratio: This exact double bottom zone sits precisely on the 61.8% Fibonacci retracement level, drawn from the explosive bull run that began at $164 in early April.
3️⃣ Dynamic 200 EMA Support: Adding to the structural strength, all of this price action is resting directly on the 200-day EMA. Historically, this moving average has acted as a formidable dynamic support for Nvidia.
4️⃣ Bullish MACD Divergence: On the oscillator side, the MACD shows a clear bullish divergence forming exactly where the price carved out its double bottom. This indicates a strong quantitative shift in momentum, often preceding impulsive upside moves.
🎯 Medium-Term Targets & Prudence:
While these four factors immediately tempt us to look for long positions, we must zoom out and consider the medium-term structure. Because we have the earnings presentation right around the corner, we need to respect the historical resistance zones (red boxes) looming above:
* Immediate resistance sits at $214.
* Secondary structural resistance is found at $230.
* The ultimate test will be the all-time highs (ATH) from May around $235.
Because of these overhead supply zones, the most prudent approach is to manage risk tightly, avoid over-leveraging, and wait for confirmed daily closes above resistance before heavy exposure.
---
*⚠️ Disclaimer: This analysis is strictly for educational purposes and is intended solely to intellectually enrich our trading community. It is NOT financial or investment advice. Always execute your own research and manage your risk accordingly.*
