NASDAQ 100: Near Highs - 26,000-24,500 Is My Buy Zone
ONE RULE ABOVE EVERYTHING: THE MARKET IS ALWAYS RIGHT
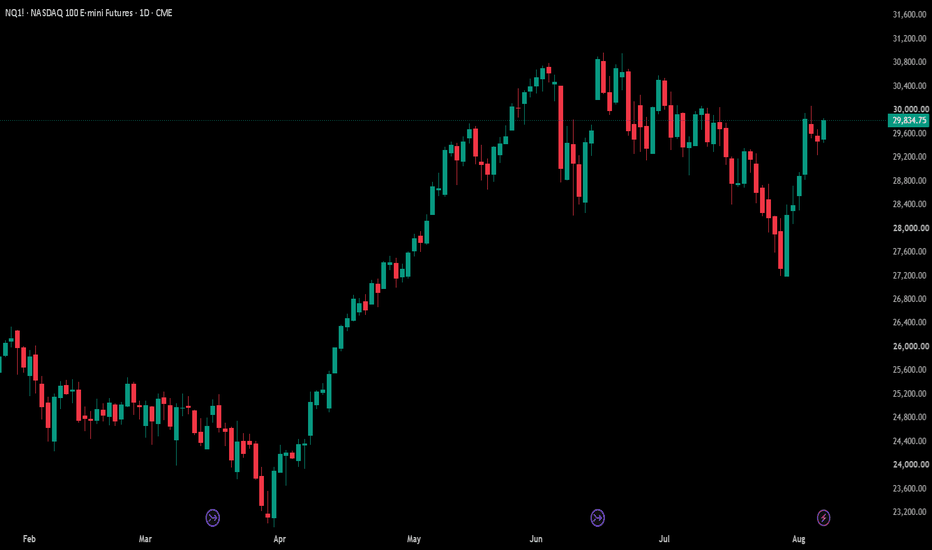
Nasdaq 100 futures are trading around 29,800, within a few percent of their highs. And
the level I care about most is 26,000 - roughly thirteen percent below the price. Those
two sentences sit uncomfortably next to each other on purpose, and I promised in the
gold post that this number would get its own chart and its own invalidation. Here it
is.
Let me be precise about what "watching 26,000" means, because it is NOT a short call.
The market is making highs, and the market is always right - shorting strength because
it feels expensive is how people fund other people's retirements. Watching 26,000 means
something much less dramatic and much more useful: it is the top of a zone - 26,000
down to 24,500 - where my long-term panel says the next truly informative decision
happens. And I will say the constructive half out loud: if the market ever rotates
into that zone while the bigger structure holds, 26,000-24,500 looks to me like the
best buying area this index is likely to offer. Above it, dips are traffic. Inside
it, the trend takes the exam - and I intend to be a buyer while it passes.
Five things follow from that, and they are the only part of this you should copy:
1. Write the invalidation before the entry. If you cannot name the exact close that
would prove you wrong, you do not have a thesis, you have a hope. Write it down while
you are calm, because once you are in, your memory becomes your defence lawyer.
2. Never argue with a close - only with your own model. Losing money is expensive.
Defending a broken idea is far more expensive, because it also costs you the next ten
trades.
3. Size it so that being wrong is survivable and boring. If the stop hurts, the size is
wrong, not the stop.
4. Never short something only because it is expensive. Expensive is not a signal - it
is a feeling wearing a valuation costume. Strength dies on broken closes, not on
adjectives, and until a close breaks, the uptrend is the fact and your discomfort is
the opinion.
5. A level is an appointment, not a prophecy. I do not predict that 26,000 prints. I
have decided, in advance and in writing, what I will do if it does. Set the alert, put
the plan next to it, and go live your life. The moment you attach a date to a level,
you have turned a plan back into a hope.
A MARKET AT HIGHS IS STILL A SUPERPOSITION
In quantum mechanics a system genuinely holds several outcomes at once, each with a
weight, and the measurement is what forces one of them. Nothing about a market at highs
changes that. Strength narrows the distribution - it does not collapse it.
From 29,800, two branches stay live at the same time: acceptance above the 31,000 area
that extends this trend with me still respecting it, and a rotation toward 26,000 -
which, and this is the part people refuse to hold in their heads, would be an ordinary
thirteen percent correction inside a bull market, not the end of the world. Below that
sits the twelve-month floor near 22,800, and that one IS a different world.
Holding "new highs" and "minus thirteen percent" in mind simultaneously is not
indecision. It is the only honest description of the distribution. Anyone who shows you
just one branch is not showing you their edge - they are hiding their other hand.
MONTHLY - WHERE 26,000 LIVES

The monthly is the only timeframe where 26,000 means anything. On this panel the
question is not "up or down this month" - it is whether the expansion from the 22,800
low is still being defended in an orderly way, and how much of it the market could give
back without changing regime. That give-back zone is exactly where the 26,000-24,500 area sits.
Read it this way: the monthly decides how much this trend is allowed to correct while
still being called healthy. A visit to that zone that holds on monthly closes would be the strongest continuation
evidence this market could print - which is exactly why it reads as a buying area to
me, staged and unhurried, not one heroic order. A visit that fails there starts a very
different conversation - and the chart will announce which one it is, I do not have to.
WEEKLY - PERMISSION, NOT PREDICTION
The weekly answers one question: am I allowed to add risk here, or am I waiting? Near
highs, that discipline matters more than anywhere else, because everything looks like
permission when the tape is green.
What I want from the weekly is structure holding on closes - higher lows that survive
the week, not intraweek heroics. While that holds, pullbacks are entries, not warnings.
The week that closes through a prior defended low is the week the 26,000 conversation
stops being theoretical, and I want to have decided my response before that week
arrives, not during it.
DAILY - EXECUTION, NOT CONVICTION
The daily is where good theses go to die of impatience. At highs it serves exactly one
purpose for me: sequencing. Where do I add into weakness, where do I do nothing, and
which daily close warns me the weekly structure is about to be tested.
The daily also produces the most convincing garbage: three red days near highs look
like the top every single time, and three green days look like escape velocity. Correct
and profitable are not the same word, and the daily chart is where that gap eats
accounts.
WHY THE THREE DISAGREE - AND WHY THAT IS NORMAL
In quantum mechanics some measurements do not commute: measuring position precisely
destroys precision in momentum, not because the tools are bad, but because the two
questions are structurally different questions.
Timeframes are exactly that. The monthly asks "what regime is this" and answers: an
uptrend with a defended expansion. The weekly asks "am I allowed in yet". The daily
asks "where exactly". A nervous daily inside a calm weekly inside a strong monthly is
not a contradiction - it is three honest answers to three different questions. Demand
that all three agree and you will always be buying the top of the agreement.
FUSION READ - THE INDEX NEVER TRADES ALONE
Entanglement: measure one particle and you have said something about its partner, no
matter the distance. An equity index is the most entangled object I read - it is not
even one thing, it is a weighted vote wearing a single ticker. Four lenses, none of
them a forecast - each one a weight on the branches above.
First lens - the real rate, yield minus inflation. This is the master switch behind
every asset I track, and tech is the most rate-sensitive equity there is, because its
value lives far in the future and the real rate is the price of waiting. Restrictive
and rising real rates argue for the 26,000 branch getting heavier. Falling real rates
argue the dips stay shallow. Do not memorise a level - watch the direction, because
the correct answer flips when the regime flips.
Second lens - concentration. A handful of mega-caps effectively ARE this index now,
which means the ticker can rise while most of its own members fall. When the index
makes a high that the average member refuses to confirm, that is not automatically a
top - but it is the light on the dashboard that makes me check the other three lenses
twice. An index high with broad participation is a different animal from an index high
carried by five names.
Third lens - gold and Bitcoin, the liquidity pair from the first two posts in this
series. When they bid together WITH tech, the message is liquidity and debasement, and
equity dips keep getting bought. When gold bids while tech and Bitcoin bleed, the
message is fear, and the 26,000 appointment moves closer on the calendar. Same panel,
same read, third instrument - that is the whole point of reading markets as one
entangled system.
Fourth lens - the dollar. These companies earn everywhere, so a strong dollar quietly
taxes their earnings before any analyst updates a model, and dollar strength usually
travels with tightening liquidity - the same weather that makes long-duration assets
heavy. A heavy dollar trend is not a signal by itself. It is a headwind reading that
tilts the branch weights.
When the four lenses and my own panel lean the same way on the weekly, I act with
size. When they disagree, I take time instead. Time is a position too, and it is the
only one that never gets stopped out.
WHAT COUNTS AS AN OBSERVATION
A measurement is not a feeling, a headline, or one ugly session. It is a close on the
timeframe you named in advance. Everything else is the market still in superposition -
and you deciding to gamble on which way it resolves.
So here is mine, in writing: 26,000-24,500 is where I want the market to show me its
hand, and where I plan to buy in stages for as long as the monthly keeps defending it.
A monthly close holding that zone keeps the long-term trend honest and me constructive.
And the state that ends this entire thesis: a monthly close below the 22,800 floor.
That is the observation that collapses the "healthy correction" branch completely, and
if it prints, I do not get to keep quoting this post. That is what an invalidation is
for. It is not pessimism - it is the price of being allowed to have a view at all.
WHAT COMES NEXT
Gold, Bitcoin and crude oil are already up as their own posts, same structure - one
instrument at a time: monthly thesis, weekly permission, daily execution. Currencies
are queued next, and they are the quiet lens behind every chart in this series.
ONE HONEST NOTE ON THE FRAMING
Superposition, non-commuting measurements, entanglement - I use these as a thinking
tool, not as a claim that quantum physics moves price. I use them because they force
the two habits that actually pay: holding several outcomes at once instead of one, and
letting the measurement decide instead of me.
CLOSING NOTE
The indicators on these charts are my own private scripts and they stay private, but
nothing about the reading is hidden - the method above IS the method.
Every level named above is falsifiable on a close. Until one prints, the trend is the
fact and discomfort about valuation is only an opinion.