NAS100
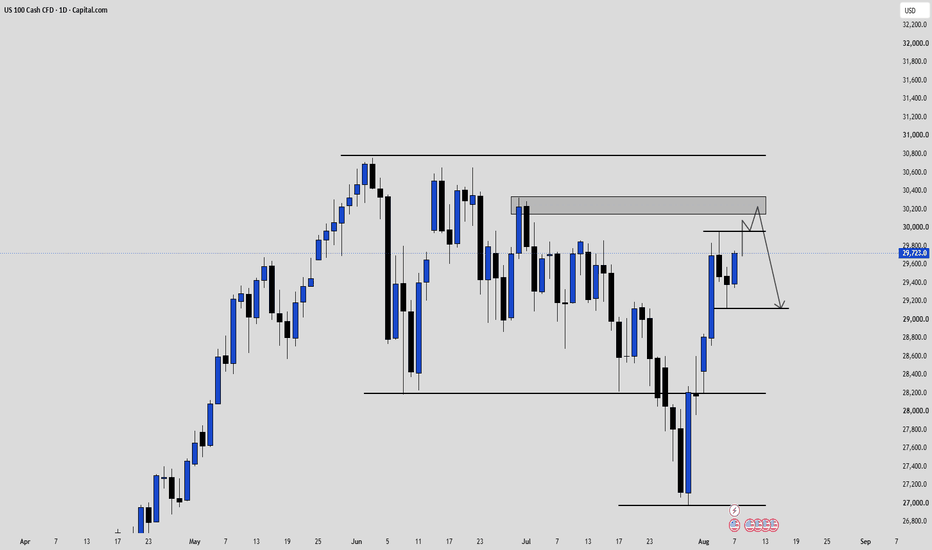
AS100 1D Chart Description
The chart shows NAS100 (US 100 Cash CFD) on the daily timeframe. The structure appears to be a large consolidation/range after a strong recovery from the ~27,000 area.
Key levels marked on the chart:
🔴 Current price: ~29,723
🟦 Resistance zone: ~30,150–30,350
🔴 Major resistance: ~30,800
🟢 Near-term support: ~29,100–29,200
🟢 Major support: ~28,200
🟢 Lower support: ~27,000
Price action
Price recently bounced strongly from the 27,000–27,200 area, broke back above 28,200, and rallied toward 29,700. The recent candles show some consolidation around 29,500–29,800.
The drawn projection suggests:
29,700 → push toward 30,000 → rejection around 30,200–30,350 → decline toward ~29,100.
So the chart is essentially anticipating a retest of the upper resistance/supply zone followed by a bearish pullback.
Important interpretation
The 30,200–30,350 zone is the key area to watch. If NAS100 rejects there, the projected move toward 29,100 makes sense technically.
However, if price breaks and closes decisively above 30,350, the bearish projection becomes weaker and the next major level is around 30,800.
In short:
Bullish recovery, but price is approaching major daily resistance. The marked setup expects a rejection from ~30.2k–30.35k and a pullback toward ~29.1k.