
GOLD (XAUUSD) H4 Weekly Analysis | Bullish Structure, RSI OB
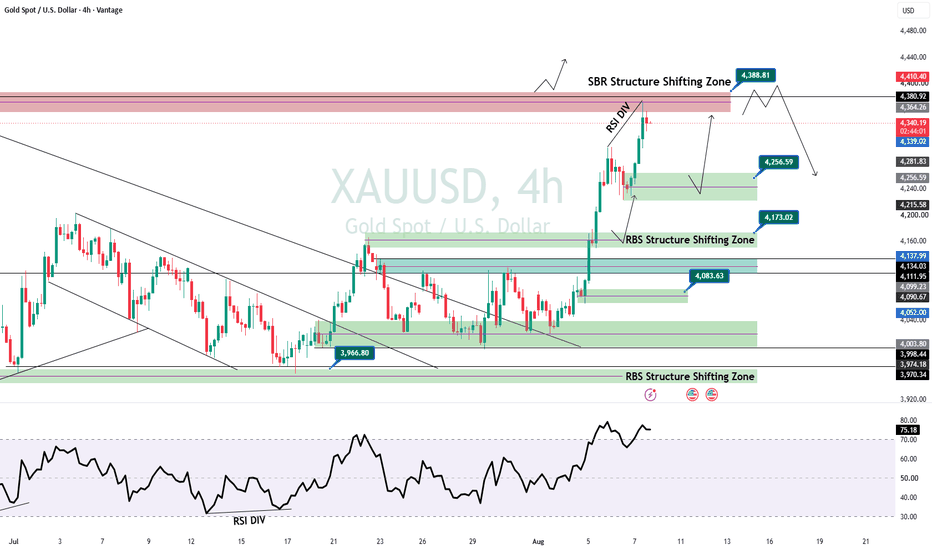
Gold (XAUUSD) remains in a strong bullish structure on the H4 chart, with price continuing to print higher highs and higher lows after breaking above multiple RBS (Resistance Becomes Support) Structure Shifting Zones.
For the weekly outlook, the key area is the current SBR Structure Shifting Zone around 4380–4390. Price is approaching this major resistance after a strong impulsive move, so a short-term rejection or consolidation is possible before the next directional move.
The immediate support zone is around 4256.59, which is the first area to watch for a healthy pullback. Below this, 4173.02 is an important RBS structure zone, while 4083.63 remains a deeper structural support.
🔑 Key Weekly Levels
🔴 Major Resistance: 4380 – 4388.81
🔴 Higher Resistance: 4410.40
🟢 Support 1: 4256.59
🟢 Support 2: 4173.02
🟢 Major Support: 4083.63
🟢 Strong Demand: 3966.80
📊 RSI Analysis
The H4 RSI is around 74, indicating strong bullish momentum but also overbought conditions. The chart also shows an earlier RSI divergence, which should be considered if Gold starts showing weakness around the major resistance zone.
📈 Weekly Outlook
As long as Gold holds above 4256, the broader bullish structure remains intact. A confirmed breakout and sustained acceptance above 4388 could open the way toward 4410+ and higher levels.
However, if price is rejected from the 4380–4390 SBR zone, a pullback toward 4256 would be a normal correction within the bullish structure. A break below 4256 could expose 4173, followed by 4083.
Overall Bias: 🟢 Bullish above 4256 | 🔴 Correction risk below 4380–4390
This analysis is for educational purposes only and should not be considered financial advice. Always wait for confirmation and manage risk properly.
