Gold Compresses In Triangle, Breakout Targets 4,159
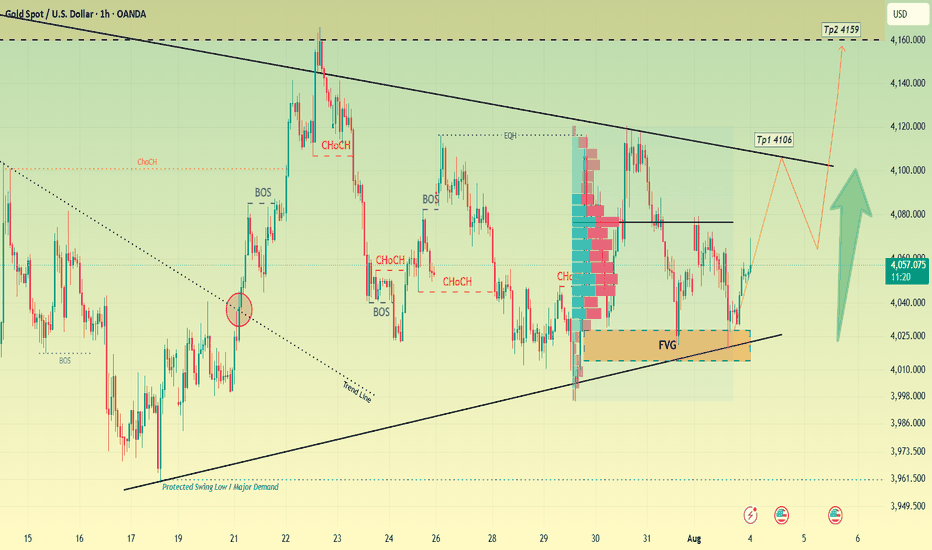
The 1H XAUUSD chart is showing a classic compression pattern that traders should be watching closely. Price has been consolidating within a symmetrical triangle, squeezed between a descending trend line capping rallies since late July and a rising trend line built off the Protected Swing Low / Major Demand zone near 3,961.
Within this range, price has left behind a fresh FVG (Fair Value Gap) zone around 4,015–4,045, an area that recently absorbed heavy volume and now serves as a key support base. Multiple BOS and CHoCH signals throughout this consolidation confirm the market has been actively repricing, rather than simply drifting sideways.
Currently trading at 4,056.045, up modestly on the session, price is holding above this FVG and pushing back up toward the equal highs (EQH) level near 4,115, right where the triangle's upper trend line converges. This kind of price action — repeated tests of a descending trend line combined with rising support — often precedes a decisive breakout, as the range simply runs out of room.
Should price clear this trend line with conviction, the projected path targets TP1 at 4,106 first, followed by TP2 at 4,159 — both realistic objectives given the momentum building within the pattern.
From a risk management perspective, the key invalidation level is a break below the FVG zone and rising trend line support (under 4,015). Such a move would suggest the triangle is resolving bearish instead, opening the door for a retest of lower demand zones.
For now, the setup favors an eventual bullish breakout, with traders watching for a confirmed close above the trend line before committing to the move toward 4,159.
Do you think gold breaks out bullish toward 4,159, or does this triangle resolve to the downside first?