
Gold Analysis & Trading Strategy | August 5
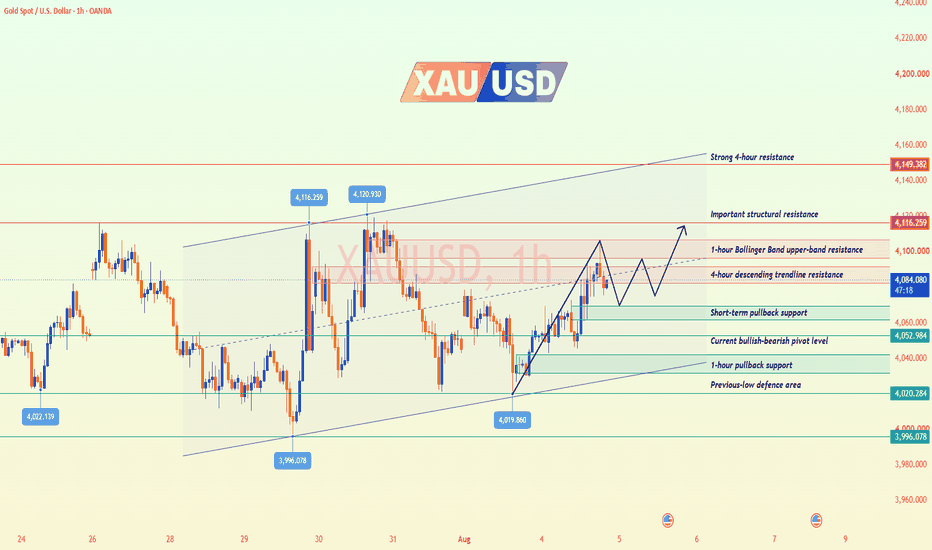
✅ 4-Hour Trend Analysis
The 4-hour chart shows that gold is still trading within a converging triangle. The overall structure continues to form progressively higher lows, but the descending trendline above has not yet been decisively broken. After rebounding strongly from above the 4052 pivot level, the price encountered resistance around 4085–4095. It remains above the Bollinger Band midline at 4063, indicating that the short-term bullish structure has not yet been damaged. However, the descending trendline and the 4085 resistance level are creating a confluence of resistance, so the current structure is better described as range-bound with a bullish bias rather than a one-sided uptrend.
✅ 1-Hour Trend Analysis
On the 1-hour chart, gold has formed a series of higher lows after rebounding from around 4019. It has also broken above the previous descending trendline and the 4052 pivot level, showing a clear improvement in the short-term structure. The price recently rallied to around 4106 before pulling back, which currently appears to be a technical correction following the advance. The Bollinger Band midline is located near 4067. As long as the price continues to hold the 4067–4052 area, the 1-hour bullish structure remains valid, and the market may retest 4085, 4095 and even 4116 after the pullback. If the 1-hour candle closes below 4052, traders should be alert to the possibility of a false breakout, with the price potentially falling further towards 4040 and 4022.
🔴 Key Resistance Levels
● 4085–4090: 4-hour descending trendline resistance
● 4095–4107: 1-hour Bollinger Band upper-band resistance
● 4116: Important structural resistance
● 4149: Strong 4-hour resistance
🟢 Key Support Levels
● 4070–4063: Short-term pullback support
● 4052: Current bullish-bearish pivot level
● 4040–4032: 1-hour pullback support
● 4019: Previous-low defence area
✅ Trading Strategy Reference
🔰 Short-Term Buy Strategy After a Pullback to Support
👉 Buy Zone 1: 4070–4063
👉 Buy Zone 2: 4055–4050
🎯 Targets: 4085 → 4095 → 4107 → 4116
🛑 The price has just pulled back from the recent high, so chasing long positions is not recommended. Consider entering only after the price shows signs of stabilisation near support, forms a long lower wick, produces a bullish engulfing pattern, or regains the short-term moving average.
🔰 Short-Term Sell Strategy After a Rebound to Resistance
👉Sell Zone 1: 4085–4095
👉 Sell Zone 2: 4105–4116
🎯 Targets: 4070 → 4063 → 4052
🛑 The 1-hour structure remains bullish, so counter-trend short positions should be kept small and only considered after a clear rejection from higher levels or a bearish reversal signal. If the price decisively holds above 4095, the risk for short positions will increase significantly.
🔔 If you find my analysis helpful, please like, share, and stay tuned for future updates. Your support is my motivation to continue sharing professional insights. Wishing everyone smooth trading and steady profits!
