

GOLD: A Superposition at $4,400 — Which State Collapses First?
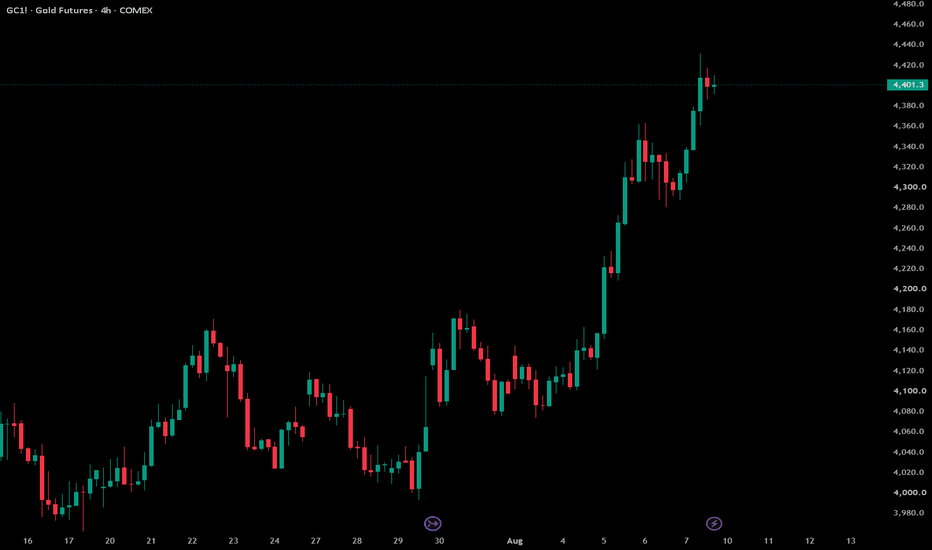
My own system is printing Sell on the weekly and Strong Buy on the monthly at the
same time. Same indicator, same data, opposite conclusions. Below are all three
timeframes exactly as my panel printed them, with what each one is actually saying.
Every probability stays open. I am not predicting. I am showing the frame I hold
and the condition that would end it.
ONE RULE ABOVE EVERYTHING: THE MARKET IS ALWAYS RIGHT
The market is not an opinion I get to argue with. It is the measurement. When
price closes, that is the observation, and the observation is never wrong. Only my
model can be wrong. Every rule below exists to make my model cheap to update and
expensive to defend.
Three things follow from that, and they are the only advice I would give anyone:
1. Write the invalidation before the entry. If you cannot name the exact close that
would prove you wrong, you do not have a thesis, you have a hope. Write it down
before you risk anything, because once the position is on, your memory becomes your
defence lawyer.
2. Never argue with a close - only with your own model. Losing money is expensive.
Defending a broken idea is far more expensive, because it also costs you the next
ten trades. When price disagrees with you, updating is the cheap option. Take it
early.
3. Size it so that being wrong is survivable and boring. A position that makes you
check the screen at three in the morning has already taken something the market
cannot pay back. If the stop hurts, the size is wrong, not the stop.
MONTHLY - THE THESIS LIVES HERE
Strong Buy, high conviction. First target 5,194.98, about 18 percent up, at roughly
1.5 reward to risk. Ceiling marked at 5,626.8, distance 27.89 percent.
This is the only timeframe allowed to hold the thesis. It is too slow to time an
entry and it does not pretend otherwise.

WEEKLY - THE ENTRY DECIDES HERE, AND IT SAYS NO
Sell, and the aggregate reading has gone slightly negative. First target sits below
the current price. Floor line 3,901.3, distance 11.33 percent.
Same system, one step down, opposite answer. This is not a contradiction and it is
not a refutation of the monthly. It is a timing statement. A long-term view is
allowed to sit through a weekly pullback. What it is not allowed to do is rewrite
its story afterwards and pretend it always said that.
DAILY - RIGHT DIRECTION, UNUSABLE TRADE
Strong Buy again. First target 4,492.3, only 2.1 percent away - and reward to risk
about 0.4.
Read that last number again, because it is the whole lesson. The direction is
correct and the trade is still garbage. A 0.4 reward to risk means risking more
than twice what I stand to make. Correct and profitable are not the same word.
WHY THE THREE DISAGREE - AND WHY THAT IS NORMAL
In physics, measuring position precisely destroys precision in momentum. They
cannot both be sharp at once. Charts behave the same way.
The more precisely I time an entry, the shorter the window I measure, and the less
that window can say about a trend. The more confident I want to be about the trend,
the longer the window, and the worse it is at timing. Monthly up, weekly down,
daily up is three measurement bases returning three valid answers.
The monthly carries the thesis. The weekly decides the entry. The daily is noise
until the weekly close agrees. Before that close, gold is not going up or down in
my model - it holds both, with different weights. Almost every large loss I have
watched, including my own, came from collapsing that early: picking one branch
because holding two felt uncomfortable, then spending weeks defending the pick.
WHAT 10,000 TICKS ACTUALLY MEANS
I will say it plainly: anything under 10,000 ticks is scalping.
That is not a price target, it is a unit of measurement. On COMEX GC one tick is
$0.10 per ounce, so 10,000 ticks is about $1,000 per ounce of travel. Below that
distance I am not looking at a trend, I am looking at noise with good lighting.
Above it, structure has to exist, because price cannot travel that far without
leaving evidence of who was buying and where.
NEVER READ GOLD ALONE
Gold, silver, copper, platinum, palladium - I read the whole metals complex.
Correlated systems share information, so measuring one tells me something about the
others. When the complex moves together, the move has a body behind it. When gold
runs while silver and copper refuse, the correlation has broken, and that is the
earliest warning available.
I also refuse to read price in isolation from the cost of money. If I could keep one
macro input and throw the rest away, I would keep rates - metal is priced against the
cost of holding money. That one relationship explains more gold behaviour than any
oscillator I have ever tested.
And my system is allowed to say nothing. When the inputs are not agreeing it returns
neutral on purpose, rather than manufacturing a call. A system that always has an
opinion is not confident, it is lying to you.
WHAT COUNTS AS AN OBSERVATION
Not a touch. A close. I mark where price actually turned, repeatedly, and I never
buy the first touch of a level - a touch is a rumour. I wait for the reclaim close:
price closing back above the level is buyers proving they won, not hoping. Then at
least 2:1 reward to risk, or I pass. That single filter is why the daily setup above
does not get my money today.
THE QUESTION THAT COMES UP MOST
When does it move? My answer has not changed: it moves once you cut your loss.
That sounds harsh. It is mechanical. Price travels toward where positions have to be
closed, and the last cluster of stops sitting under an obvious level is fuel. If you
place your stop where everybody else placed theirs, you are not managing risk, you
are supplying it. You are not standing outside the system observing it. You are part
of what gets measured.
THE STATE THAT ENDS THIS THESIS
A weekly close that loses the level the move launched from, or the metals complex
splitting apart while gold pushes alone. Either observation and the thesis is gone -
I stand down and re-mark. A thesis with no exit condition is not a thesis, it is a
wish.
One honest note on the framing. Superposition, measurement, entanglement - I use
these as a thinking tool, not as a claim that quantum physics moves price. I use
them because they force the two habits that actually pay: holding several outcomes
at once instead of one, and letting the measurement decide instead of me.
One honest note on the framing: this is a thinking tool, not a claim that quantum
physics moves price. I use it because it forces the two habits that pay - holding
several outcomes at once, and letting the measurement decide instead of me.
WHAT COMES NEXT
Gold is one instrument. The same three-timeframe reading works everywhere, and the
disagreements between the three are just as informative. Long term I am watching
Nasdaq toward 26,000 - I will not defend that number here, it needs its own chart
and its own invalidation level. Crypto, crude oil, currencies and a few others are
queued the same way. I will run them one instrument at a time, same structure:
monthly thesis, weekly entry, daily execution.
CLOSING NOTE
The indicators on these charts are my own private scripts and they stay private, but
nothing about the reading is hidden - the method above IS the method.
Every level named above is falsifiable on a close, which is the only standard I think
analysis should be held to. If the close does not arrive, the thesis does not exist.

