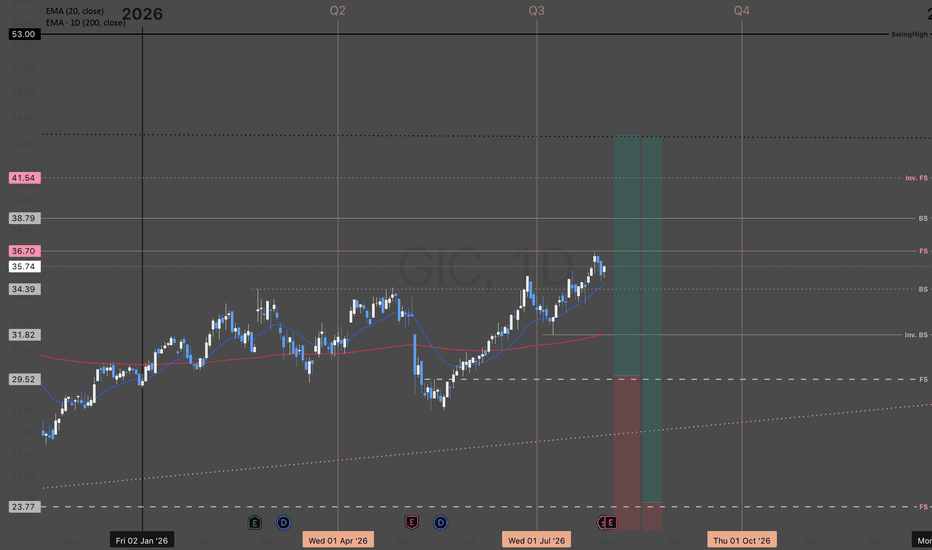
GIC | Q3 2026 - Day Chart
Global Industrial Company ||
MARKET-BEATING SCORE = 5/10
Dividend yield (indicated)
3.13%
"engages in direct marketing of brand name and private label industrial and business equipment and supplies "
-----------------------------------
PEGY 1.26 — mildly overvalued.
EPS growth 11.4% — solid.
Revenue growing 9.2% YoY — steady.
Gross margin 35.5% — decent.
FCF margin 5.5% — real cash generation.
D/E 0.31 — conservative leverage.
-----------------------------------
KEY RISK ASSESSMENT
"Could a policy change or major competitor disrupt growth in the next 2 years?"
Global Industrial Company faces moderate risk from intense competition, particularly from large-scale distributors like Amazon Business and Grainger who can leverage superior logistics and pricing power. While specific regulatory changes are not imminent, ongoing trade tensions and potential tariffs on imported private-label goods could pressure margins and disrupt the supply chain. Furthermore, the rapid shift toward digital procurement platforms requires continuous technology investment to prevent market share loss to more agile tech-centric competitors. These factors combined suggest that while growth is possible, external pressures could significantly impact performance over the next two years.
Risk Level:
Moderate
----------------------------------
POSITIVE CATALYST OUTLOOK
"Could a policy change or competitor headwinds create a positive catalyst in the next 2 years?"
Global Industrial Company is well-positioned to benefit from ongoing reshoring trends and domestic infrastructure investments, which serve as long-term policy-driven catalysts for industrial MRO demand. Additionally, a shift in customer behavior toward digital procurement allows GIC to leverage its robust e-commerce platform against less agile traditional competitors. The company’s focus on expanding its high-margin private label portfolio offers a significant cost advantage that could lead to market share gains if larger peers face inflationary pressures or supply chain bottlenecks.
Positive Outlook:
Moderate
-----------------------------------
Multiple Time-Frame Analysis; Color Code | Strength favors the higher timeframe.
Yearly timeframe = black
Monthly timeframe = pink
weekly = grey
daily = red
4hr = orange
1hr = yellow
15min = blue
5min = green if they are shown. (Level visibility on intervals is set to timeframe the level was found on and below to keep chart view organized.)
** Candle Science explained **
A Range = two or more consecutive color candles.
There are two types of ranges - accumulation and distribution. **A single candle is a range on a lower timeframe. *Find the range and define its, creation dates, prices, and risk parameters. A range is broken down into 4 candle, which create 6 levels that define the range and illustrate market structure.
Focus only on the first and last candle of each range. The last candle of each type of range has two levels - see FS & Inv. FS Candles below.
DISTRIBUTION RANGES DEFINED:
When price is above a distribution range, these candles/levels act as support.
(BS) BACKSIDE Candle - First distribution candle in a distribution range. Expectation = strong reaction to price. long wicks reaching to or away from level. high angle accumulation trends, f.v,g's
(FS) FrontSide Candle - Last distribution candle in a distribution range. Expectation = reversal, create a low angle accumulation trend. The top of Distribution candles are used as support. The bottom of the FrontSide candle is the SwingLow of the range. The FS candle wants to protect the SwingLow. When/if Price Action closes below the SwingLow, the level is invalidated. Find another range to trade.
ACCUMULATION RANGES DEFINED: When price is below an accumulation range, these candles/levels act as resistance.
INVERSE BACKSIDE (Inv.BS) - First Accumulation candle in an accumulation range. Expectation. = strong reaction to price. long wicks reaching to or away from level. Creates high angle distribution trends, f.v.g, protects the Inv.FS candle
INVERSE FRONTSIDE (Inv.FS) - Last accumulation candle in an accumulation range. Expectation = reversal, create a low angle distribution trend. The bottom of Accumulation candles are used as resistance.
The top of the Inv.FrontSide candle is the SwingHigh of the range. The Inv.FS candle wants to protect the SwingHigh. When/if Price Action closes above the SwingHigh, the level is invalidated. Find another range to trade.