BJC: Base Building & Wedge Consolidation Setup
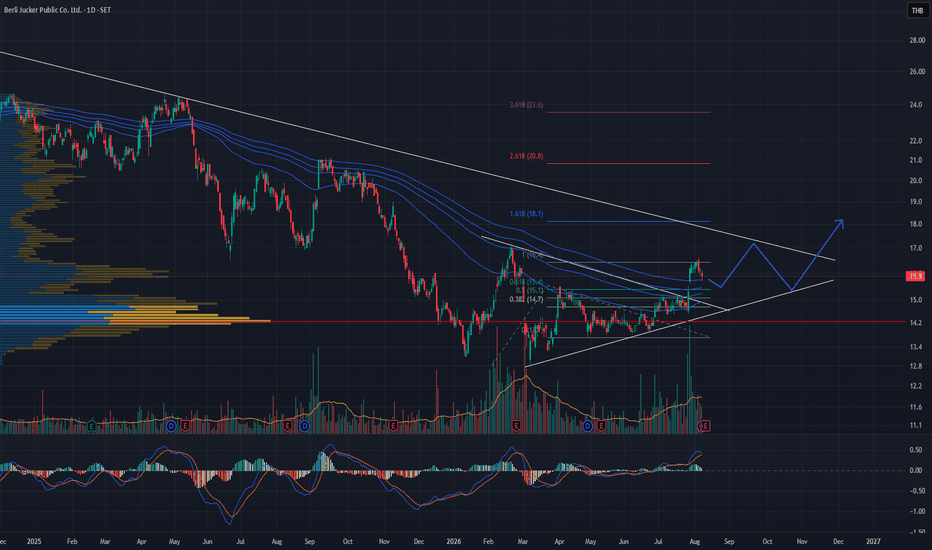
1. Technical Overview & Structure
Long-Term Downtrend: The price action remains bound within a broad descending trend channel, capped by a long-term downward resistance line originating from higher highs.
Volume Profile & Accumulation: A substantial concentration of volume (High Volume Nodes) is visible in the lower range around 14.00 – 14.20, forming a solid structural support floor and multi-month accumulation zone.
Converging Pattern (Wedge / Triangle): Price is compressing within a tightening range near key historical support, showing signs of seller exhaustion as it approaches the apex and tests the upper boundary.
2. Key Price Targets (Fibonacci Projections)
Short-Term Target (16.7 – 18.1): Aligned with the 1.0 and 1.618 Fibonacci Extension levels, serving as the initial resistance band upon a successful breakout.
Medium-Term Target (20.8): Corresponds to the 2.618 Fibonacci Extension, which comes into play if bullish momentum expands.
Long-Term Target (23.6+): Aligned with the 3.618 Fibonacci Extension, representing a structural shift back into a major bullish trend phase.
3. Risk Management
Invalidation Level / Stop Loss: A sustained breakdown below the 13.40 – 14.20 support cluster would invalidate the reversal hypothesis, indicating a continuation of the broader structural downtrend.