AUD/USD 1H — Rising Wedge Breakdown Setup
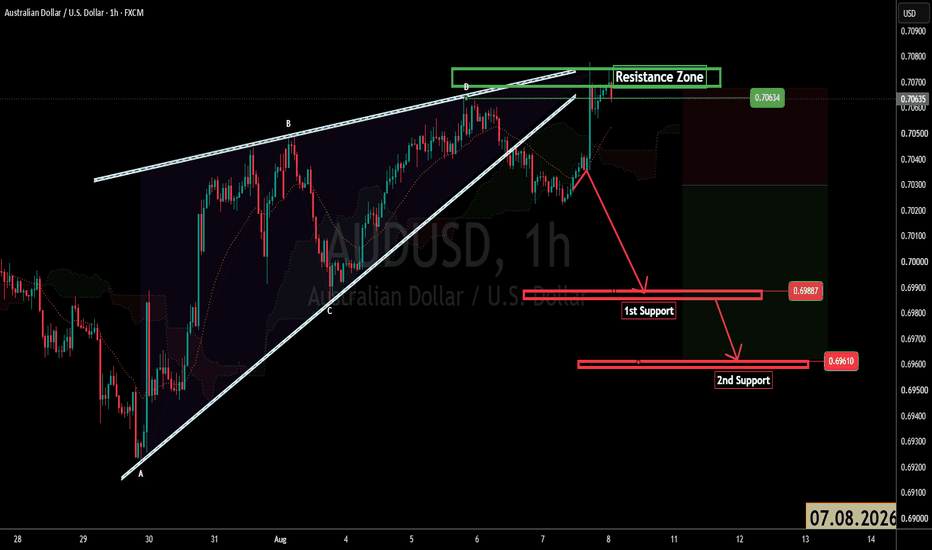
The chart shows **AUD/USD on the 1-hour timeframe** forming a **rising wedge pattern** between two converging trendlines. Price has reached the upper boundary and is testing a clearly marked **resistance zone around 0.7055–0.7063**.
### 🎯 Key Levels
* **Resistance:** 0.7055–0.7063
* **1st Support / Target:** **0.69887**
* **2nd Support / Target:** **0.69610**
* **Potential direction:** 🔻 Bearish if the wedge breaks downward
### 📉 Trade Idea
A rejection from the resistance zone followed by a break below the wedge's lower trendline could trigger a move toward:
**Target 1 → 0.69887**
**Target 2 → 0.69610**
The chart's projected path shows price falling from the resistance area toward the first support and potentially continuing to the second support.
### Suggested Chart Title
**“AUD/USD 1H — Rising Wedge Breakdown | Targets 0.69887 & 0.69610”**
**Bias:** 🔴 Bearish below **0.7063**, with **0.69887 → 0.69610** as the projected downside targets.