

TradingView Idea — XAUUSD 30M
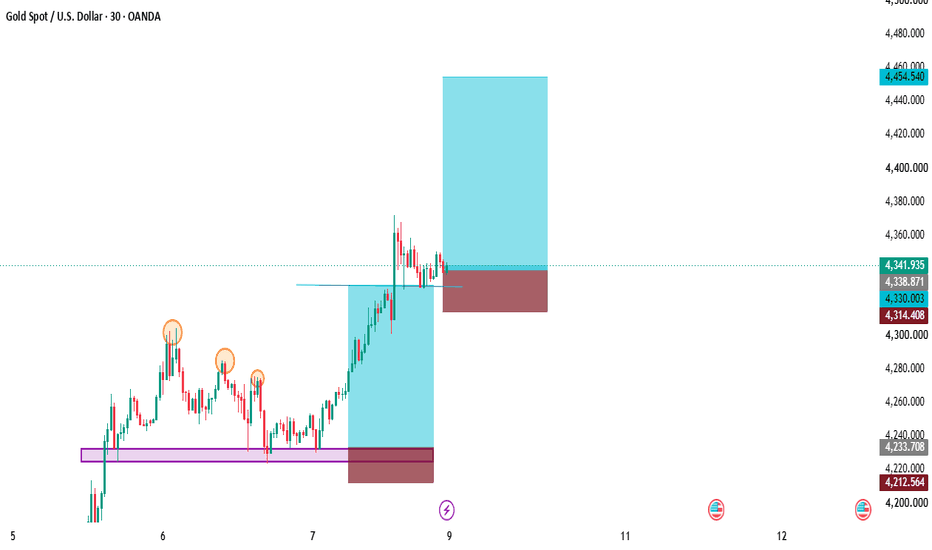
Gold (XAUUSD) – Structure & Key Levels
Gold has shown a strong upward move after reacting from the lower highlighted zone around 4233–4212. Price then formed higher highs and higher lows, indicating improving short-term structure.
At the moment, price is consolidating around the 4330–4340 area after the recent upward expansion. This zone is important for determining whether the current structure can continue.
Key levels from the chart:
4338–4340: Current decision area
4330: Near-term structural level
4314: Important downside reference level
4233–4212: Major lower support zone
4454: Upper chart objective/reference
The chart shows a possible continuation scenario while price remains above the marked structural levels. A sustained move above the recent consolidation could bring the upper area near 4454 into focus.
If price loses the nearby structure, the setup would need to be reassessed rather than assuming continuation.
This is a technical chart study based on price structure and marked levels. Always consider your own analysis and risk management.

