$ETH/USDT Weekly Descending Trendline
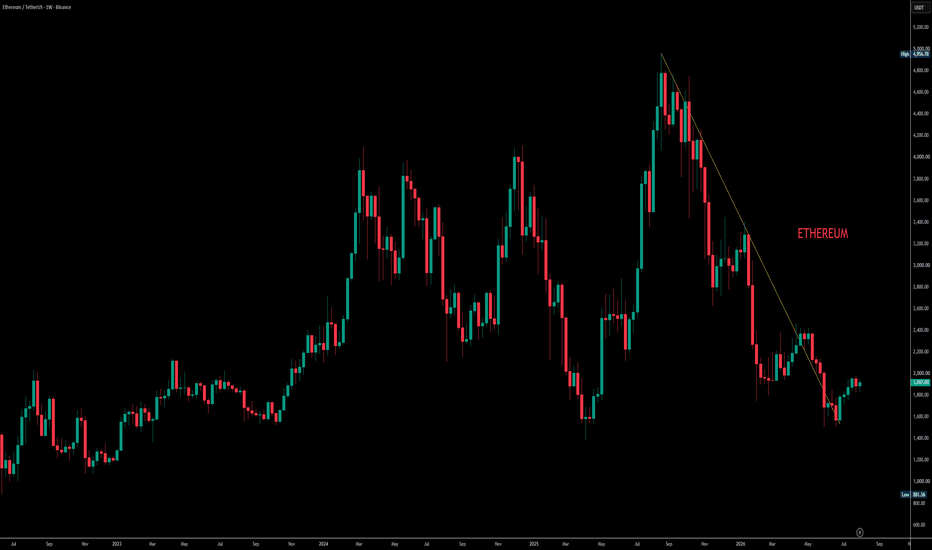
ETH/USDT on the 1-week timeframe is trading around the $1,918 zone after a prolonged decline from the 2025 high near $4,950. The chart shows a clear descending trendline, with lower highs forming beneath the resistance line.
The key support zone is around $1,550–$1,600, where price recently found a reaction. Immediate resistance is around $2,000, followed by the descending trendline near $2,350–$2,400.
A weekly breakout above $2,400 could provide confirmation of a trendline breakout. If confirmed, ETH could potentially move toward the $3,000–$3,300 resistance region, representing approximately 25–40% upside from the current zone.
If price fails to break the trendline and loses the $1,550–$1,600 support, the bullish breakout setup could be invalidated, with the downside structure remaining intact.
This is a chart-based technical setup only. Watch for weekly confirmation above resistance before considering the breakout valid.