
S&P 500 ($SPX) Daily: Resistance Rejection
S&P 500 (
 SPX
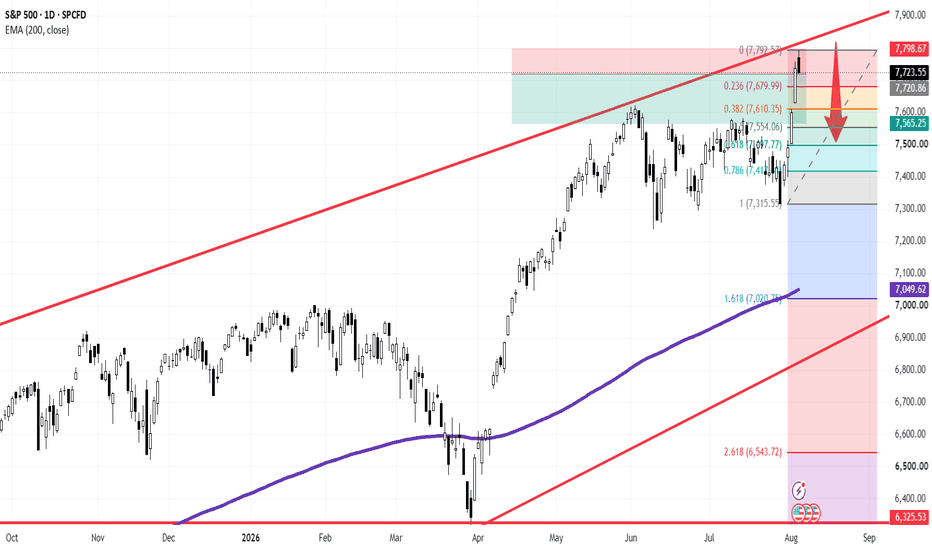
) Daily: Resistance Rejection at Upper Channel Boundary Drives Corrective Pullback Toward 7,550 Fibonacci Zone
SPX
) Daily: Resistance Rejection at Upper Channel Boundary Drives Corrective Pullback Toward 7,550 Fibonacci Zone
### 🇺🇸 USA S&P 500 Index (
SPX
) Daily Technical Matrix (Ref: SPX_2026-08-06_10-13-35.png)
We are releasing an updated Daily (1D) structural framework on the S&P 500 Index (
SPX
/ US500). Following an aggressive expansion into all-time high territory, price action has encountered significant sell-side resistance directly against the upper trendline boundary of its macro ascending channel.
The benchmark index is currently experiencing a controlled intraday pullback, trading down **-0.17% (-12.97 pts)** at **7,723.55**, after probing peak highs of **7,793.68**.
---
### 🔍 Technical Architecture & Pullback Mechanics:
Our quantitative setup highlights a projected mean-reversion phase (red arrow vector) originating from major supply confluence:
1. **Upper Channel Rejection (Red Top Line):** The peak rally capped precisely at the **0 Fibonacci level (7,792.57)**, forming a clear rejection wick against the macro ascending channel resistance ceiling (**7,798.67**).
2. **Corrective Trajectory & Fibonacci Retracements:** Sell-side absorption at record highs sets up a corrective retracement leg aimed at testing key demand nodes:
* **Immediate Support (0.236 Fibo):** **7,679.99**
* **Secondary Support (0.382 Fibo):** **7,610.35**
* **Primary Target Zone (0.5 Fibo Floor):** **7,554.06 – 7,565.25** (highlighted green demand node).
* **0.618 Golden Ratio Node:** **7,477.77**
---
### 🛡️ Strategic Operational Scenarios:
* **Scenario A — Corrective Pullback to Fibo Support (Red Arrow):** A continuation of short-term profit taking will drive price action down toward the **7,610.35** (0.382 Fibo) and **7,554.06 – 7,565.25** (0.5 Fibo) retest zone, where buyers are expected to re-emerge to establish a higher low.
* **Scenario B — Direct All-Time High Breakout:** A decisive daily close breaking above **7,798.67** invalidates the pullback projection, unlocking immediate trend expansion toward the **7,900.00** psychological milestone.
### 📊 Tactical Parameters Summary:
* **Current Bias:** Short-Term Bearish Rejection / Corrective Pullback
* **Major Overhead Resistance Ceiling:** 7,792.57 – 7,798.67
* **Immediate Support (0.236 Fibo):** 7,679.99
* **Primary Pullback Target (0.5 Fibo Zone):** 7,554.06 – 7,565.25
* **Institutional Risk Baseline (200-EMA):** 7,049.62
---
📊 **ChartPro Data**
*US Equity Architecture, Channel Rejection Mechanics & Systematic Risk Management.*
⚠️ **Disclaimer:** For educational and informational purposes only. This active market study represents a personal trading framework and does not constitute financial or investment advice.
