QCOM — A GOOD BUSINESS IN AN AWKWARD CHART LOCATION
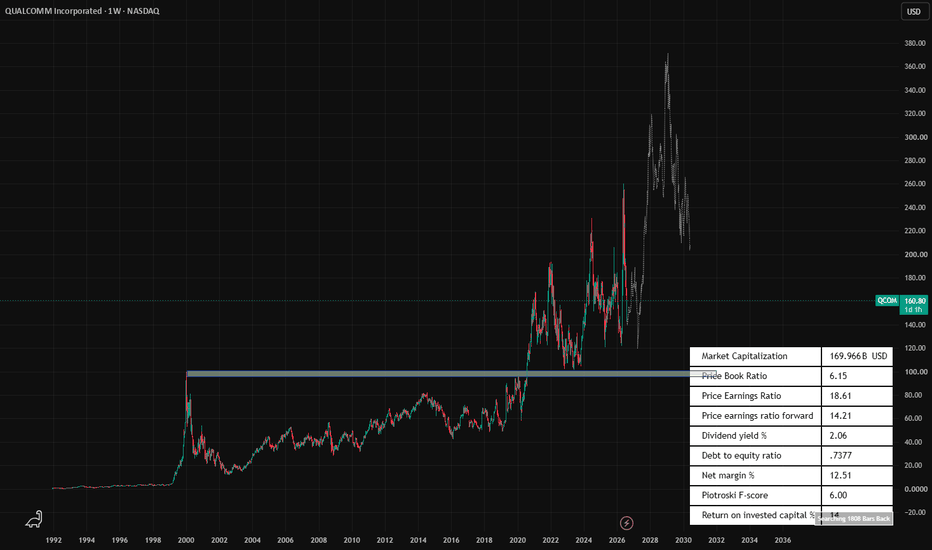
Qualcomm's long-term chart has a single defining level: the January 2000 dot-com peak near 100. It capped the stock for twenty years. Price reclaimed it in 2020, and — this is the part that matters — defended it at the 2022 low. A twenty-year ceiling that becomes a tested floor is about as strong a structural statement as a weekly chart makes.
Since that reclaim, the stock has been violently range-bound rather than trending: 193 in 2022, back to 101, up to 230 in 2024, back to the 120s, then a spike toward 260 and another sharp rejection. Four full swings in five years, each high a little higher, each drawdown brutal.
Price is now 160.67 — almost exactly the middle of that range. That is the honest problem with this chart. The business looks better than the location.
STRUCTURE I'M WATCHING
Recent high .......... 260 ....... Spike and rejection. Not yet a level, just a print.
Resistance 2 ......... 230 ....... The 2024 high. Needs reclaiming to confirm a new leg.
Resistance 1 ......... 190 – 195 . The 2022 high. First genuine test above current price.
Current .............. 160.67 .... Mid-range. Worst place to commit.
Support 1 ............ 140 ....... Visible congestion from the 2021–25 churn.
Support 2 ............ 120 – 125 . Recent swing low. The preferred entry area.
Structural floor ..... ~100 ...... The 2000 high, reclaimed 2020, defended 2022.
Thesis invalidation .. below 100 . A twenty-year level failing changes everything.
The projection toward 365 and back to 205 is a pattern-matching overlay. It is describing a prior fractal, not forecasting this one. Not a target.
WHAT THE CHART IS TELLING ME
- The 100 band is the real story. Twenty years of resistance, reclaimed and then successfully retested. That is a durable floor and it is why the long-term bias here is up rather than down.
- Higher highs, but violent ones. 193 > 230 > 260 is technically an uptrend. Drawdowns of 45%+ between each one mean the trend is not tradeable without a wide stop.
- Mid-range offers no edge. At 160 there is roughly 30 points to first resistance and 20 to first support. Nothing about this location produces a favourable ratio.
- The spike to 260 rejected hard. Vertical moves that reverse quickly leave trapped supply overhead, and that supply sits between here and any new high.
FUNDAMENTAL BACKDROP — THE BEST OF THE BUNCH
P/E trailing ....... 18.60 .... Reasonable for a quality semiconductor name
P/E forward ........ 14.21 .... LOWER than trailing — consensus expects earnings to GROW
Debt / equity ...... 0.74 ..... Conservative. Real balance-sheet flexibility
Dividend yield ..... 2.06% .... Genuine income support at the lows
ROIC ............... ~14% ..... Comfortably above cost of capital
Piotroski F-score .. 6 / 9 .... Solid financial health signals
Price / book ....... 6.14 ..... Full, but normal for an asset-light IP business
Net margin ......... 12.51% ... The soft spot — compressed versus historical levels
Market cap ......... 169.8B ... Mid-teens forward multiple on a mega-cap franchise
Note the direction of travel: a forward multiple BELOW the trailing multiple means the market expects earnings to rise, not fall. Combined with 0.74x leverage and a 2% dividend, this is a fundamentally sound setup — the opposite profile to a highly levered name hoping for a recovery.
The one thing I would interrogate is that 12.51% net margin, which sits well under what this franchise has historically delivered. Find out whether that reflects a one-off charge or genuine ongoing pressure — the answer changes the forward multiple's credibility entirely. Licensing renewals and modem-share concentration are the structural questions behind it. Verify against the latest filing.
INVALIDATION
Long-term thesis: a decisive weekly close below 100 breaks the reclaimed dot-com level and invalidates the structural bull case outright.
Tactical: any long taken in the 120–140 zone is wrong on a weekly close below 118.
RISKS WORTH NAMING
- Customer concentration. A single large handset customer bringing modems in-house is the known, repeatedly-delayed overhang. It is priced in until it isn't.
- Licensing is the profit engine. QCT ships the volume; QTL earns the margin. Adverse renewal or regulatory outcomes hit earnings disproportionately.
- Handset cyclicality. Smartphone demand is mature; auto and IoT diversification is real but not yet large enough to offset a bad phone cycle.
- Range risk, not trend risk. This stock has drawn down 45%+ from every high since 2020. Position for that, not for a smooth advance.
- A cheap forward multiple on falling estimates stops being cheap. Watch revisions, not the static number.
TRADE PLAN
Preferred entry .... 120 – 140 on a weekly reversal with volume
Alt entry .......... Weekly close above 195 to confirm range resumption
Invalidation ....... Below 118 tactically; below 100 for the structural thesis
Target 1 ........... 195
Target 2 ........... 230
Sizing ............. Wide stops required. Size for 45% drawdowns, not 10% ones
No position at 160. Mid-range is where good setups go to die — the fundamentals justify a watchlist slot, not a market order.
Not financial advice — my own chart interpretation, shared for discussion. Fundamental figures are read from a data panel and should be verified against current filings before acting. Manage your own risk.