
BASING AFTER THE SHOCK, BUT THE RECOVERY IS ALREADY IN THE PRICE
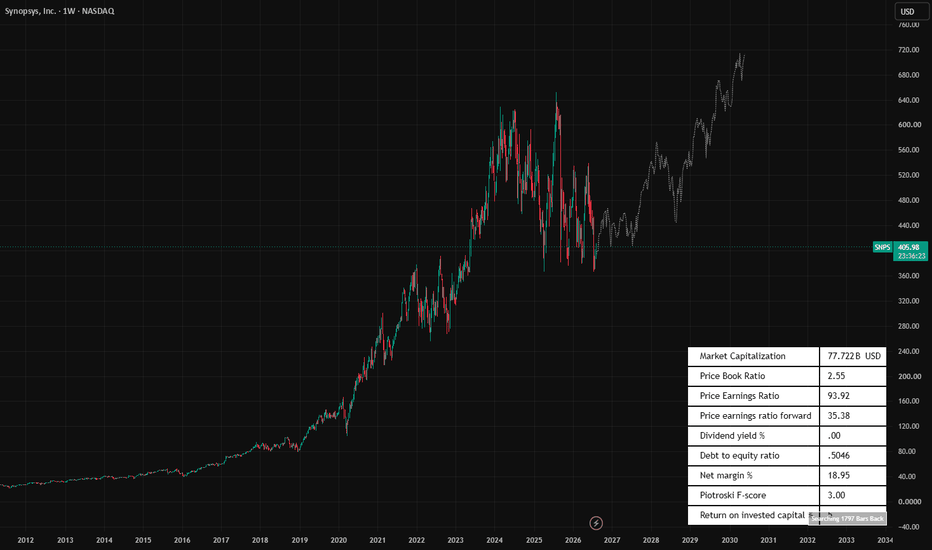
Synopsys compounded almost without interruption for a decade: roughly 30 in 2012 to about 650 by 2025. Then a single-week collapse of near vertical proportions took the guidance reset straight through the chart, and price has spent the time since grinding out a low near 365 — a drawdown of roughly 44% from the high.
This week is the most constructive bar in months. Up 4.43%, range 386 to 412, closing near the high on decent volume. That is what the first leg off a low looks like.
It is also one week. The question this chart poses is not whether 365 was a low — it may well have been — but whether you are being paid to buy the recovery at 406 when the forward multiple already assumes the recovery happens.
STRUCTURE I'M WATCHING
All-time high ....... 630 – 650 . Pre-shock. Requires full thesis re-validation.
Resistance 2 ........ 500 – 520 . Mid-vacuum. Thin overhead, could move quickly.
Resistance 1 ........ 440 – 450 . The breakdown shelf. The level that confirms a base.
Current ............. 405.98 .... Off the low, mid-range, unconfirmed.
Support ............. 365 – 380 . The 2026 low and post-shock base. The reference.
Invalidation ........ below 360 . Base failure.
Deep support ........ 270 ....... The 2022 low. A long way down, and the honest downside.
The gap between 412 and 630 is largely vacuum — the crash traversed it in one bar, so very little volume traded there. That cuts both ways: rallies through empty air move fast, and there is no support inside it either.
On the projection toward 720 by 2030: pattern overlay, not forecast. Not a target.
WHAT THE CHART IS TELLING ME
- A one-bar collapse is different from a distribution top. The decade-long uptrend was not sold off over months; it was repriced in a week on news. That leaves the long-term structure damaged but not necessarily broken.
- 365 has held and this week is a real reaction. Close near the high of a 26-point range with volume is a buyer signature, not a dead-cat bounce signature.
- But nothing is confirmed below 440. Until the breakdown shelf is reclaimed on a weekly close, this is a bounce inside a base, not a trend change.
- The vacuum overhead is the opportunity. If earnings do recover, there is almost no trapped supply between 450 and 600 to slow it down.
FUNDAMENTAL BACKDROP — THE FRANCHISE IS ELITE, THE FINANCIALS ARE MID-DIGESTION
P/E trailing ....... 93.92 .... Optically extreme. Reflects depressed, charge-laden earnings
P/E forward ........ 35.38 .... A large expected recovery — already priced in
Net margin ......... 18.95% ... Compressed from historical low-to-mid 20s
Debt / equity ...... 0.50 ..... Moderate, but a real change from a near debt-free history
Piotroski F-score .. 3 / 9 .... Weak. Consistent with an acquisition-digestion year
Dividend ........... None ..... No income support
Price / book ....... 2.55 ..... See the flag below — this is NOT a value signal
Market cap ......... 77.7B .... Full price for a business mid-restructuring
DATA FLAG: the 2.55 price/book looks cheap only because a large acquisition loaded the balance sheet with goodwill and intangibles. Book value was inflated by the deal, not by earning power. Do not treat it as an asset floor.
The business itself is about as good as software gets — an EDA duopoly, mission-critical to every chip designed, with enormous switching costs and recurring revenue. That quality is not in question. What is in question is the bridge: amortisation, integration costs, dilution and debt are all suppressing reported earnings right now, and a 35x forward multiple says the market expects that to resolve cleanly.
That is the tension. You are not buying a cheap stock. You are buying a great franchise at a full price on the assumption that a messy year is temporary. Verify the latest quarter, integration progress, and any updated guidance yourself — that assumption is the entire idea.
INVALIDATION
A decisive weekly close below 360 breaks the post-shock base and puts the 270 area in play. On a name with no dividend, a 3/9 Piotroski score and 94x trailing earnings, I would not average into that.
Softer warning: repeated rejections at 440–450 with the low being retested means the base is widening, not completing.
RISKS WORTH NAMING
- The recovery is priced, not delivered. A 35x forward multiple on estimates that have already been cut once means a second cut hits price hard.
- Integration risk is live. Large acquisitions in mature software routinely take longer than guided. Amortisation does not wait for synergies.
- Export controls and China exposure. Design-software access is a live policy instrument, and restrictions land on revenue immediately.
- Guidance shock precedent. This stock has now demonstrated it can lose a third of its value in a single session. Position for gap risk, not volatility risk.
- Vacuum works downward too. Thin volume between 412 and 630 means there is nothing to catch price on the way back down either.
- AI demand is a tailwind, not a guarantee. More chips designed should mean more EDA seats, but that has not stopped the earnings compression so far.
TRADE PLAN
Confirmation entry .. Weekly close above 450 to confirm the base
Value entry ......... Retest of 365 – 385 that holds with volume
Invalidation ........ Weekly close below 360
Target 1 ............ 500
Target 2 ............ 560 – 580
Geometry ............ Roughly 2:1 from 406; closer to 3:1 from 380
Sizing .............. Gap risk is proven here. Size smaller than the chart alone suggests
Not buying 406 into an unconfirmed base. Either the retest holds or the shelf gets reclaimed — both give better odds than the middle.
Not financial advice — my own chart interpretation, shared for discussion. Fundamental figures are read from a data panel, one of which is materially misleading; verify everything against current filings before acting. Manage your own risk.

