
is rAMDUSDT Bullish BOS Above 495 or Revisit 420?
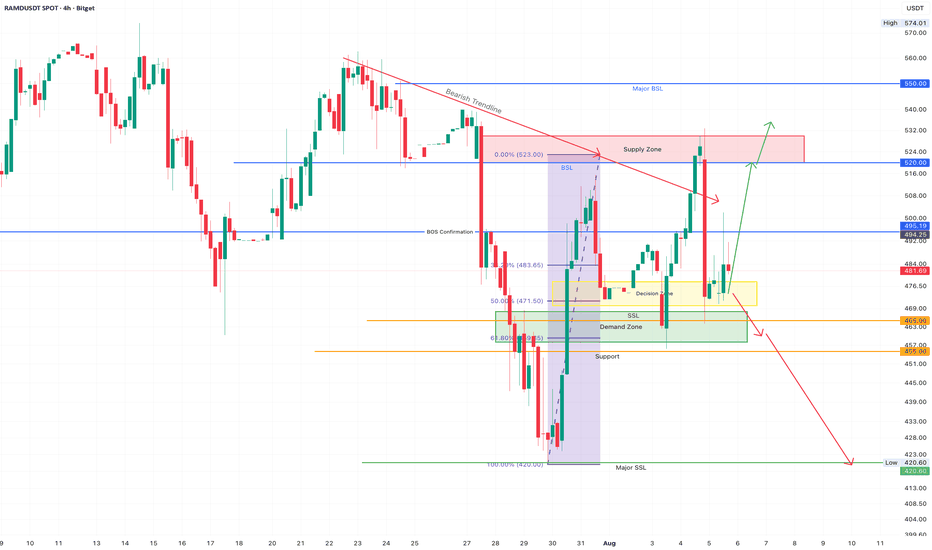
RAMDUSDT is trading inside a key decision zone after a strong recovery from the 420.6 swing low. Buyers have defended the 4H demand area, but the broader structure is still transitioning from a bearish trend, meaning confirmation is needed before expecting a sustained move higher.
Bullish Scenario
The current demand zone continues to align with the 50% and 61.8% Fibonacci retracement, giving buyers a technically important area to defend. A bullish break and 4H close above 495 would confirm a Break of Structure (BOS), opening the door for a move toward the buy-side liquidity resting above.
Targets:
520: Buy-side Liquidity
530: 4H Supply Zone
550: Major Buy-side Liquidity
If this bullish scenario confirms, I'll look to increase my exposure instead of selling my existing rAMD. Since Bitget allows rToken to be used as collateral, I can pledge my rAMD, borrow USDT, and add to my position while keeping my original holdings ahead of earnings.
Bearish Scenario
Failure to hold the current decision zone would invalidate the bullish thesis. A decisive 4H close below 465 would suggest sellers have regained control, increasing the probability of a move toward lower liquidity.
Targets:
455: Intermediate Support
420.6: Major Sell-side Liquidity
If this bearish scenario plays out, I won't rush to sell my rAMD holdings. Instead, I'd hedge the downside using RAMD Stock Perps on Bitget, allowing me to manage downside risk while maintaining my long-term exposure into earnings.
Technical Confluences
Descending trendline continues to act as dynamic resistance.
50% and 61.8% Fibonacci retracement align with the 4H demand zone.
Strong reaction from demand suggests buyers remain active.
520-530 remains the primary supply zone where sellers previously stepped in.
Key Levels
Bullish Confirmation: 495
Bullish Targets: 520 → 530 → 550
Bearish Trigger: 465
Bearish Targets: 455 → 420.6
I'll be watching 495 closely, as reclaiming that level would strengthen the bullish structure and shift focus toward the 520-530 supply zone. Until then, the current range remains a decision area. If buyers fail to defend 465, I'd expect liquidity below to become the next objective, making a hedge.
