𝗚𝗕𝗣/𝗨𝗦𝗗 – 𝗕𝘂𝗹𝗹𝗶𝘀𝗵 𝗦𝗰𝗲𝗻𝗮𝗿𝗶𝗼
𝗚𝗕𝗣/𝗨𝗦𝗗 – 𝗕𝘂𝗹𝗹𝗶𝘀𝗵 𝗦𝗰𝗲𝗻𝗮𝗿𝗶𝗼
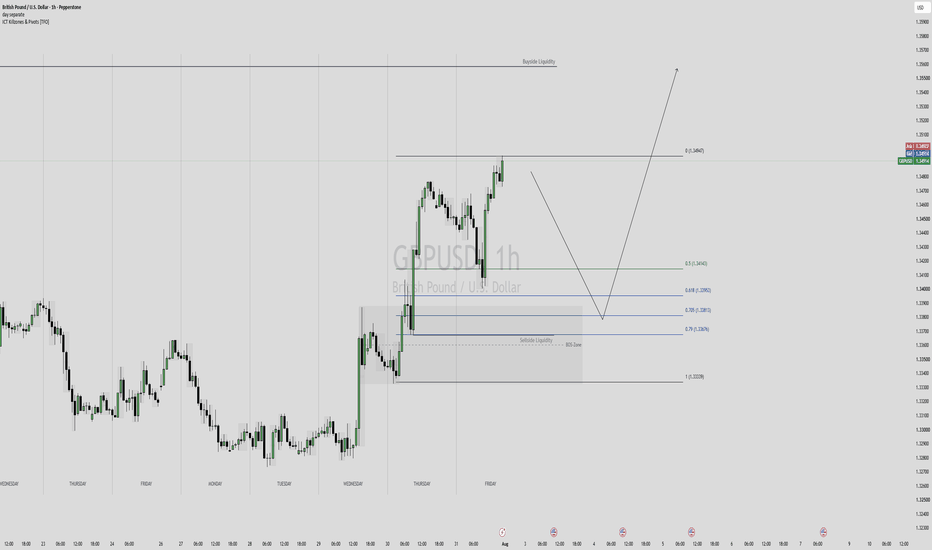
GBP/USD is currently showing a **bullish structure**, with interesting **buyside liquidity above current price**.
Last Thursday, price broke H1 market structure to the upside, creating the **BOS zone**.
Price then retraced back into this area and left **sell-side liquidity** behind.
If we draw the Fibonacci from the last swing low to the current price, this sell-side liquidity sits in an **extreme discount area**, almost exactly around the **0.79 Fibonacci level**.
𝗠𝘆 𝘀𝗰𝗲𝗻𝗮𝗿𝗶𝗼:
Price could retrace into this area, take the sell-side liquidity and then react bullishly.
On the lower timeframes, especially **M5 or M15**, I will be looking for a **bullish MSS** as confirmation.
𝗦𝗲𝗹𝗹𝘀𝗶𝗱𝗲 𝗥𝗮𝗶𝗱 → 𝟬.𝟳𝟵 𝗗𝗶𝘀𝗰𝗼𝘂𝗻𝘁 → 𝗠𝗦𝗦 → 𝗟𝗼𝗻𝗴 → 𝗕𝘂𝘆𝘀𝗶𝗱𝗲
The target would be the **buyside liquidity above**.
But as always:
**The scenario is planned. The market decides.**
𝗡𝗼 𝗥𝗮𝗶𝗱. 𝗡𝗼 𝗠𝗦𝗦. 𝗡𝗼 𝗧𝗿𝗮𝗱𝗲.
𝗧𝗿𝗮𝗱𝗲 𝗣𝗹𝗮𝗻 𝟴 𝗶𝘀 𝗿𝗲𝗮𝗱𝘆.
𝗡𝗼𝘄 𝘄𝗲 𝘄𝗮𝗶𝘁.