BTC Grinds 63.4K - Coldcard Shock - Aug 02 AM
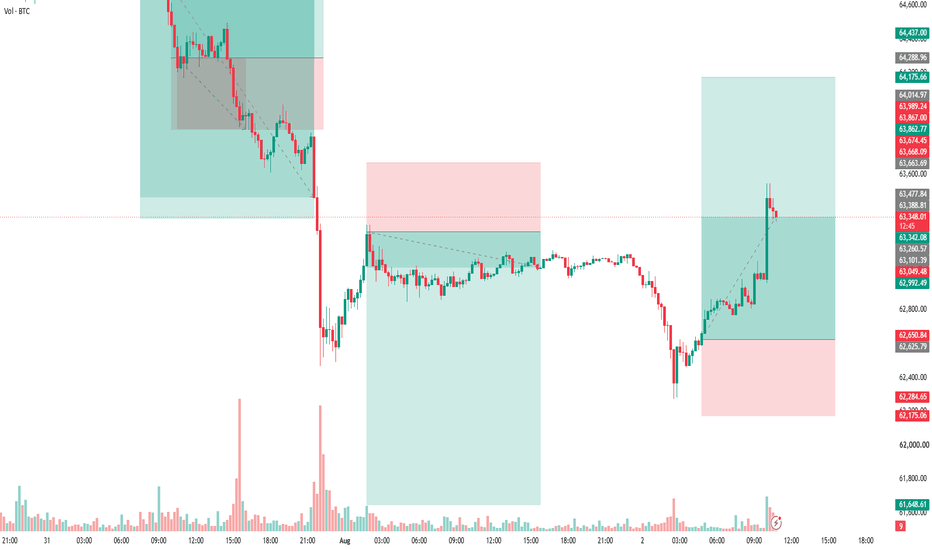
Current Price & Time:
BTC is trading at 63358 USDT as of 2026-08-02 02:46 UTC. Price action shows a tight consolidation directly on the 1H EMA55 pivot, with the market digesting a bearish hardware wallet security headline that has yet to trigger a liquidity cascade.
Multi-Timeframe Structure:
The daily structure remains bearish, with price below the 1D EMA55 and the histogram printing negative momentum divergence against the prior rally attempt. The 4H timeframe is mixed but tilting bearish: price sits above the 4H MA5 and MA10, yet the MACD histogram is still negative and RSI at 31.91 indicates oversold conditions that have not produced a sustainable reversal. On the 1H, the picture is the most critical: price is hovering just 0.17% above the EMA55 at 63249.10, with only 1 of the last 8 hourly closes above that line. This fails the trending threshold, but the proximity to the EMA55 raises range-bound probability. Overall structure is mixed with a bearish bias unless the 1H can print two consecutive closes above 63249.
Chart Signals:
The 15M MACD histogram is expanding positively with DIF above DEA, and RSI at 75.96 signals short-term overbought conditions. This creates a convexity trap: the intraday momentum is bullish, but the higher timeframe momentum is failing. The 1H MACD histogram is positive and rising, but RSI at 58.30 is nowhere near exhaustion levels, suggesting the bounce has room before hitting resistance. The 4H RSI at 31.91 is the key signal — it reflects a positioning squeeze lower that has stalled, but without a momentum divergence on the 4H, the data suggests this is a mean reversion bounce rather than a trend reversal. Watch for a long upper wick on the 1H near resistance to confirm topping pressure.
Key Liquidity Levels (Demand/Supply):
Demand (Support): 63128 (1H MA10), 62877 (1H MA30)
Supply (Resistance): 63567 (1D MA5), 63730 (4H MA30)
Chart Markup Guide for this setup:
Draw a horizontal dashed line at 63249.10 — this is your bull/bear pivot. Mark the Demand zone between 62877 and 63128 with a green rectangle. Mark the Supply zone between 63567 and 63730 with a red rectangle. Watch for a 15m close above 63567 as the trigger for the long scenario, but note that a failure to hold 63249 on an hourly close would flip the bias bearish.
Scenario Analysis (If-Then):
If BTC holds above 63249 on an hourly close and then reclaims 63567, then the upside target is 63730, then 64113 (1D MA10). If BTC breaks below 63249 with two consecutive hourly closes, then the downside target is 62877, then 62400 (the next structural support from the July 31 low). A break below 62877 would likely trigger a liquidity cascade toward the 62000 handle, given the thin bid stack below the 1H MA30.
Trading Plan:
Direction: Bearish bias above 63249, but only short on a confirmed rejection at 63567 or a break below 63249.
Entry: Short on a 1H close below 63249, or on a 15M rejection pattern at 63567 with a long upper wick.
Stop-Loss: 63750 (above the 4H MA30 and 1D MA5 confluence).
Target-1: 62877
Target-2: 62400
Risk-Reward Ratio: 1:2.1 to Target-1, 1:3.4 to Target-2.
Invalidation Level:
The setup is invalidated if BTC prints two consecutive hourly closes above 63750. That would signal a momentum shift, negating the bearish structure and opening the door for a retest of the 1D MA5 at 63567 as support. Additionally, if the 4H MACD histogram flips positive while price holds above 63249, the mean reversion thesis weakens and longs become viable above 63567.
Disclaimer:
This analysis is for informational and educational purposes only. It does not constitute financial advice. Past performance is not indicative of future results. All trading decisions carry risk and are your sole responsibility.
📊 QilanX Backtest Reference
🕒 Last Backtest: 08-02 07:00:01
Total Signals: 3352 Backtested: 3348 Accuracy: 82% (2747/3348)