WTI Crude Oil (XTI/USD) – Rebound Off the 200-day
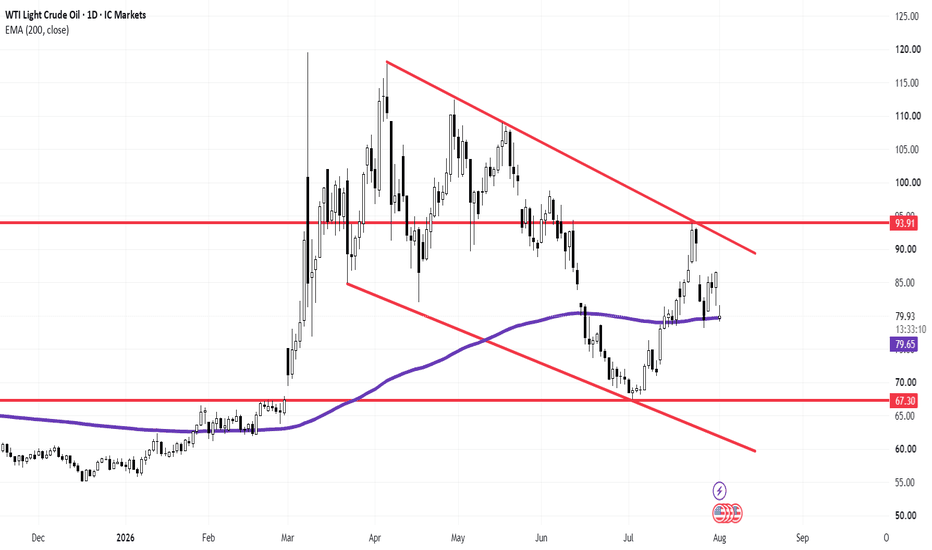
WTI Crude Oil (XTI/USD) – Rebound Off the 200-day EMA Eyes Major Compression Resistance
WTI Crude Oil (XTI/USD) has staged a sharp recovery on the daily chart, bouncing strongly after defending its 200-day Exponential Moving Average (EMA) (sitting at $79.65). The asset is now compressing inside a large multi-month symmetrical wedge structure (red trendlines), setting the stage for a high-conviction directional breakout.
Technical Breakdown:
The 200-day EMA Support ($79.65):
Bulls successfully defended the 200-day EMA at $79.65, validating it as a reliable dynamic floor.
As long as price action trades above this purple moving average, the immediate daily momentum favours the upside.
The Major Resistance Zone ($93.91 & Upper Trendline):
The primary upside target and critical barrier for the bulls sits at $93.91 (horizontal resistance), which closely aligns with the upper descending trendline (LTB).
A decisive daily close above $93.91 would signal a structural breakout, paving the way for a rally towards the psychological $100.00 threshold.
The Bearish Breakdown Scenario ($67.30 Target):
Conversely, if sellers step in near the $93.91 resistance and force a rejection back below the 200-day EMA ($79.65), the bullish recovery will be invalidated.
A breakdown below $79.65 would open the doors for a retest of the major macro demand floor at $67.30.
Trading Insight: Watch the reaction closely as price approaches the $93.91 resistance level. A clean breakout above $93.91 opens long positions towards $100.00+, whereas a rejection offers a short-swing opportunity back down to test the 200-day EMA ($79.65).