

BTCUSD | Trendline Structure and Key Price Zones | 15M
Bitcoin / U.S. dollar BITSTAMP:BTCUSD
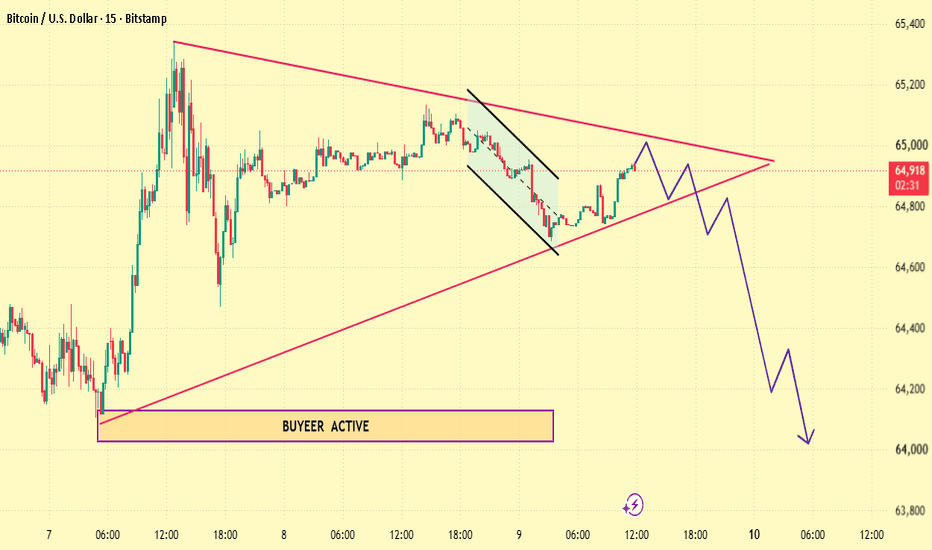
The chart shows Bitcoin respecting an ascending trendline that started from the lower 64K area. Price has repeatedly created higher lows along this structure.
At the same time, the market is approaching the horizontal resistance zone around 65,350–65,400.
Technical Structure
Higher lows ✔️
Rising trendline ✔️
Resistance near 65.4K ✔️
Current price near 64.93K ✔️
Levels to Monitor
64,800 — trendline area
64,600 — first support
64,300 — next support
64,100 — lower reference
65,000 — psychological level
65,200 — intermediate resistance
65,350–65,400 — major resistance
