BTCUSD: Pullback Into Key Support Before Trend Continuation
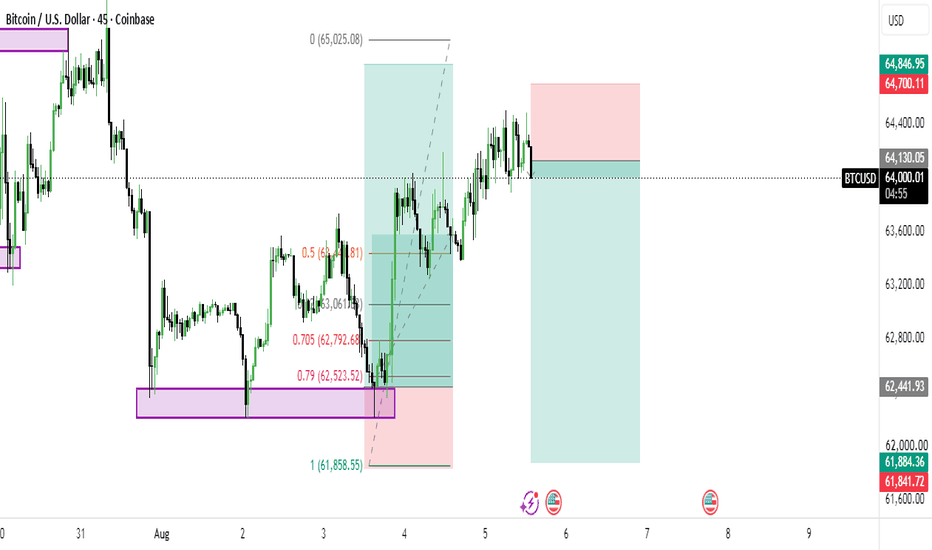
The chart highlights a bullish market structure after a strong reaction from the highlighted demand zone. Price respected the Fibonacci retracement area around the 0.705–0.79 levels before continuing with higher highs and higher lows.
At the moment, price is testing a previous intraday resistance area. A temporary pullback toward the highlighted support zone could help maintain the current structure if buyers continue to defend higher price levels.
Key observations:
Higher highs and higher lows remain intact.
Fibonacci retracement aligned with a strong reaction zone.
Previous resistance may act as support.
The highlighted green area represents a possible continuation zone.
The red area marks the level where the current structure would begin to weaken.
This chart is based on market structure, support and resistance, and Fibonacci analysis. Shared for educational discussion.