$BTCUSD Cycle Analysis (2013–2026)
 BTCUSD
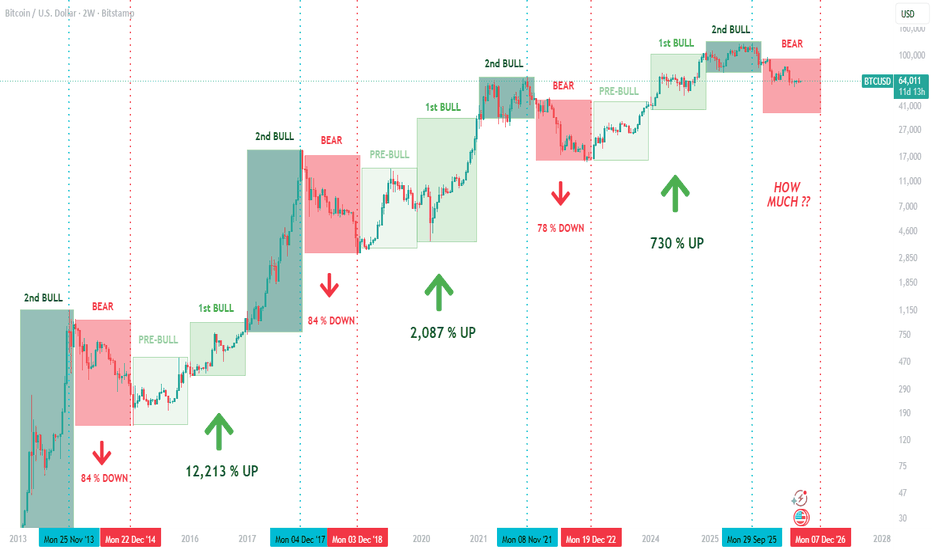
long-term structure continues to follow a consistent 4-year cycle rhythm:
BTCUSD
long-term structure continues to follow a consistent 4-year cycle rhythm:
• Bear Years (After every 4-Year): 2014, 2018, 2022, 2026
• Bull Expansions (3-Year Spans): 2015–2017, 2019–2021, 2023–2025
• Phase Sequence: Bear ➔ Pre-Bull ➔ 1st Bull ➔ 2nd Bull
Bull Market Returns:
• 2015–2017: +12,213%
• 2019–2021: +2,087%
• 2023–2025: +730%
Bear Market Drawdown:
• 2014: -84%
• 2018: -84%
• 2022: -78%
• 2026: Currently in progress
While bull market expansions show clear logarithmic diminishing returns, bear market drawdowns are also becoming less severe over time as institutional liquidity matures. If 2026 follows this trajectory (drawdown capping under ~65–70% from ATH), the market is working through its standard 4-year reset before the next Pre-Bull accumulation phase begins in 2027.