BTCUSD 4H
Bitcoin CRYPTO:BTCUSD
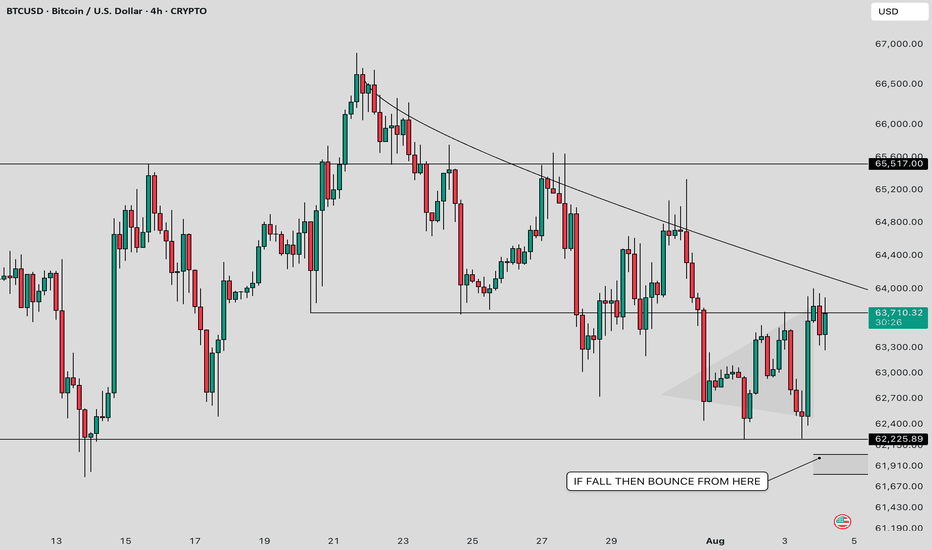
Chart Concept & Observation :
The highlighted box in this chart represents a potential support and resistance zone, where price has historically reacted and may continue to do so.
- If any bullish or bearish price action pattern / candlestick formation appears near the upper or lower boundary of this box, it may indicate a possible reversal opportunity.
- In some cases, the market may also respect the midpoint (50% level) of the box. Therefore, any significant price action signal forming around this level can also lead to a potential reversal.
- Additionally, if liquidity zones/lines are marked above or below the box, price may be drawn toward those areas before reacting.
- For better reversal confirmation, lower timeframe analysis can also be used to refine entries.
Disclaimer :
This chart is shared purely for educational and journaling purposes only. It reflects my personal market observations and thought process.
- I am not a SEBI-registered financial advisor.
- This is not a buy/sell recommendation, trading signal, or investment advice.
- No calls or tips are being provided here.