BTC/USD Bearish Reversal Setup – Resistance Rejection & Downside
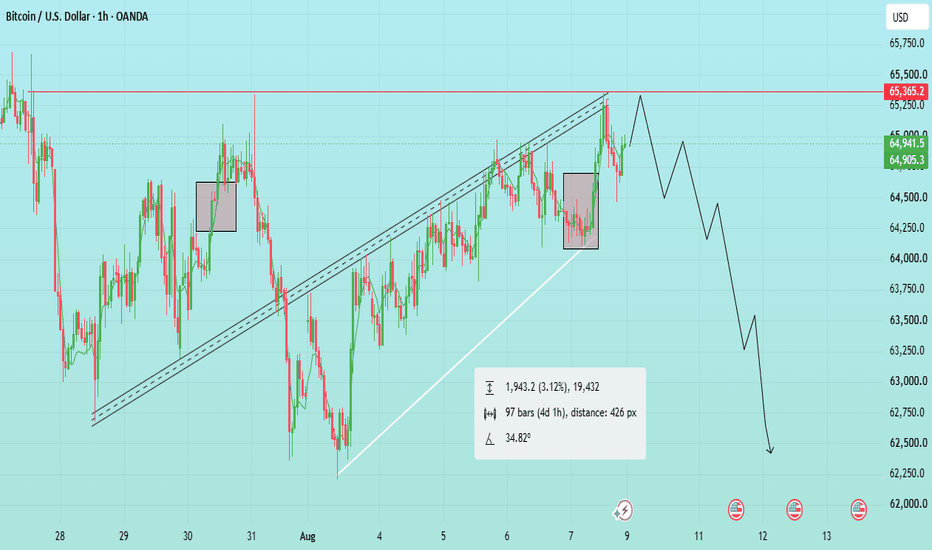
Bitcoin is showing a potential bearish reversal setup on the 1-hour chart after approaching the major $65,350–$65,400 resistance zone. Price has been moving upward inside an ascending structure, but the recent rejection near the upper trendline suggests that bullish momentum may be weakening.
🔴 Key Resistance
$65,350–$65,400 — Major resistance / rejection area
A clean break and sustained close above this zone could invalidate the bearish setup.
🟢 Important Support Zones
$64,500–$64,300 — First support
$64,000–$63,800 — Key structure/support zone
$63,500–$63,200 — Next downside area
$62,500–$62,300 — Major projected target zone
📊 Market Structure
Price has been respecting an ascending trendline, but the chart projection indicates a possible breakdown followed by lower highs and lower lows. If BTC fails to reclaim the resistance zone, sellers could gradually take control.
🎯 Bearish Targets
TP1: $64,500
TP2: $64,000
TP3: $63,500
TP4: $62,500
⚠️ Invalidation
A strong breakout above $65,400 with confirmation could invalidate the bearish scenario and open the possibility of further upside.
Overall Bias: 🔴 Bearish below $65,400 resistance
Use proper risk management and wait for confirmation before entering a trade.