BTCUSD | Daily Inverse Head & Shoulders
BTCUSD | Daily Inverse Head & Shoulders
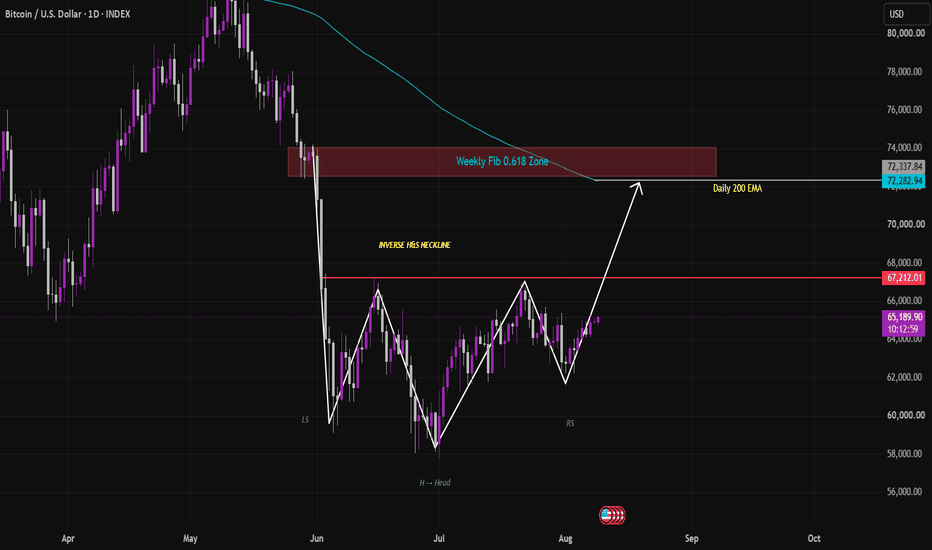
Bitcoin appears to be forming a potential Inverse Head & Shoulders pattern on the Daily timeframe.
The structure shows:
Left Shoulder → Head → Right Shoulder
The key level to watch is the 67,212 neckline. A confirmed breakout and hold above this level could open the way toward the 72.3K resistance zone**.
Key Confluences
🔹 67,212 — Inverse H&S Neckline
🔹 72,280–72,338 — Weekly Fib 0.618 Zone
🔹 Daily 200 EMA — Around 72.3K
The 72.3K area is an important higher-timeframe resistance because the Weekly 0.618 Fib and Daily 200 EMA are closely aligned.
Bullish scenario: Daily breakout and hold above 67.2K → potential move toward 72.3K.
Invalidation: Failure to reclaim the neckline and a breakdown below the right-shoulder structure would weaken the setup.
This is my personal technical analysis based on market structure and multi-timeframe confluence. The pattern is not confirmed until the neckline is broken. Not financial advice. Always manage your risk.