
BTC/USD Bearish Reversal at Major Resistance – Strong Sell Setup
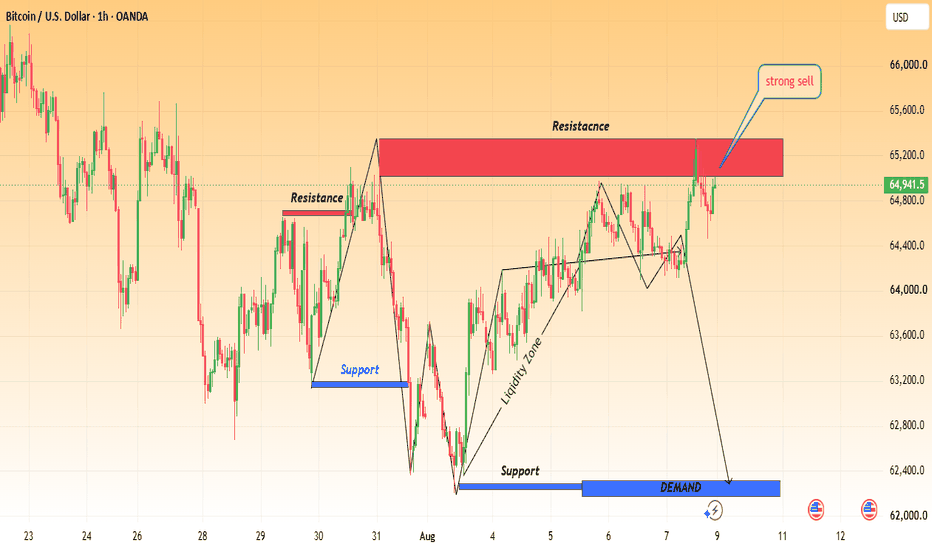
Bitcoin (BTC/USD) is approaching a major resistance zone around 65,000–65,300, where price has previously faced strong selling pressure. The chart shows a potential bearish rejection from this area, suggesting that sellers may regain control if the resistance continues to hold.
🔴 Resistance Zone: 65,000–65,300
This is the key area to watch. A clear rejection here could trigger a downside move.
📍 Current Price: Around 64,941
🎯 Bearish Targets
TP1: 64,400
TP2: 64,000
TP3: 63,200
Major Target: 62,300–62,400 Demand Zone
🔵 Demand Zone: 62,200–62,350
This area is marked as a strong demand/support zone and could become the next major reaction area if bearish momentum continues.
🛑 Invalidation: A strong breakout and sustained candle close above 65,300–65,600 would weaken the bearish setup and could open the way toward higher levels.
📌 Trading Plan
Wait for bearish confirmation/rejection around the resistance zone before considering a short position. Avoid entering blindly in the middle of the range. Manage risk carefully and keep position size appropriate.
Overall Bias: BEARISH 📉
Resistance → Rejection → Downside Targets → Demand Zone
This is technical analysis, not a guaranteed prediction. Use proper risk management.
