BTC/USD 4H Analysis Trendline Breakdown
Bitcoin vs US Dollar, Spot CFD BITSTAMP:BTCUSD
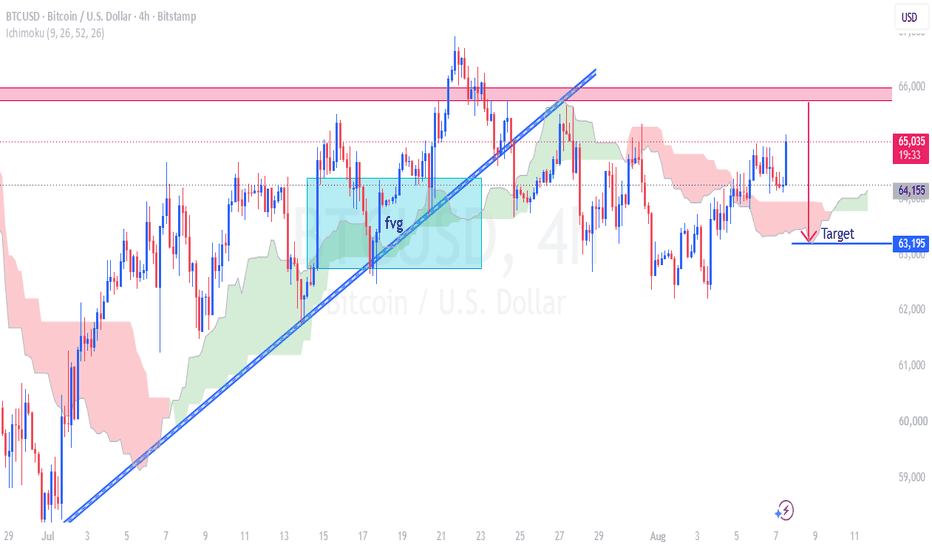
Bitcoin (BTC/USD) on the 4-hour chart appears to have broken below a key ascending trendline after multiple support tests. Price is now facing resistance near the **$65.8K–$66K** zone, while the Ichimoku Cloud suggests weakening bullish momentum. If the rejection continues, BTC could decline toward the highlighted support and target around **$63,195**, where previous demand may re-enter the market. A sustained move back above resistance would invalidate the bearish scenario and shift momentum back in favor of buyers.