KenKem MVP — BTC US session scenario map (2026-08-07 12:00 UTC)
 BTCUSD
— US session read from my KenKem Master Volume Profile (MVP) indicator & strategy.
BTCUSD
— US session read from my KenKem Master Volume Profile (MVP) indicator & strategy.
CONTEXT
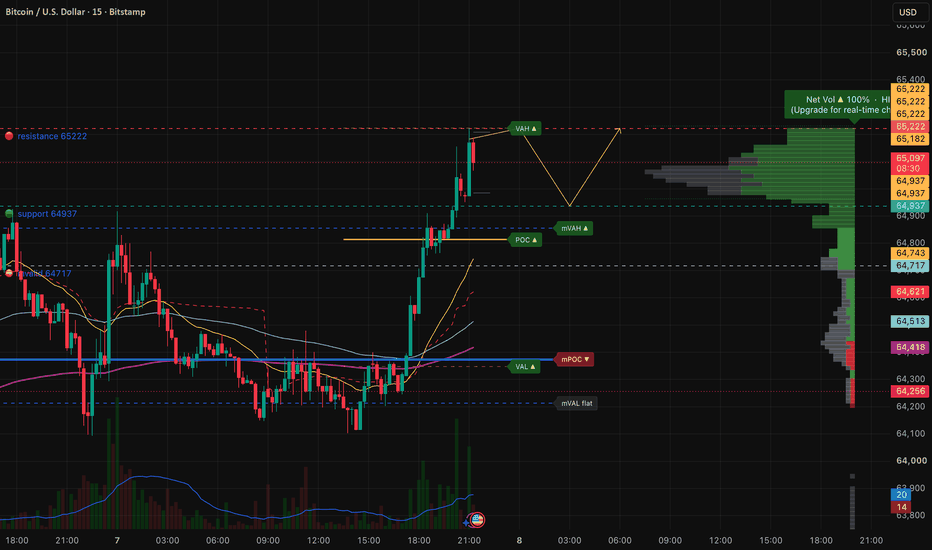
Read taken at 12:10 UTC, in the gap between the London close and the New York open (12:30 UTC), so this is an outlook map rather than an in-session call. Price has run from 64,094 to 65,222 over roughly the last 25 hours and now sits above VWAP and above all four EMAs on both M15 and M5, with the MVP value area and Point of Control still well below price. The net-volume read is fully on the buy side but saturated, which is strength and a warning at the same time.
KEY ZONES
Resistance / supply: 65,222 (day high, fresh value-area high)
Support / demand: 64,937 (M5 EMA25), then the 64,850 volume shelf, then 64,717
Point of Control (volume magnet): around 64,820 on M15
SCENARIOS (to watch — NOT signals)
Bullish: a close above 65,222 opens room toward 65,350 then the 65,500 round level (price above VWAP and all EMAs, volume expanding into the push).
Bearish: rejection at 65,222 and a close back under 64,937 opens 64,850 then 64,717 (price is stretched roughly 0.9% above VWAP, so a pull back to the mean is normal).
Range/unclear: stuck between 64,937 and 65,222 — stand aside until a decisive close.
Invalidation: a close below 64,717 voids this map and points back toward VWAP and the lower value area.
WHAT THE MVP TOOL IS SHOWING
The Master Volume Profile plots rolling value areas (VAH/VAL), the Point of Control, and a net-volume pressure read to locate where volume is building or drying up. This idea is the qualitative output of that tool; the strategy's internal thresholds, gating and entry/exit logic are not disclosed.
Built with the KenKem Master Volume Profile indicator & strategy.
Technical analysis only, by KenKem's algorithm — NOT financial advice. Trade your own plan and manage your risk.