Bitcoin Tests $64,500 Resistance — Pullback Toward $62K Possible
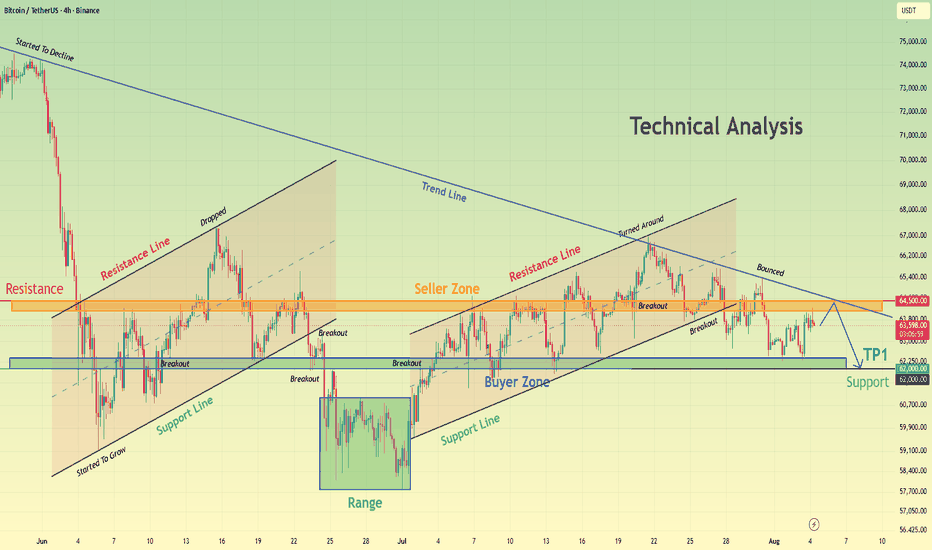
Hello traders! Here’s my technical outlook based on the current BTCUSDT (4H) chart structure. BTCUSDT previously recovered from the 62,000 Buyer Zone and advanced inside an ascending channel before reaching the 64,500 Seller Zone, where sellers regained control. Price then rejected from the long-term descending trendline and broke below the channel support, signaling weakening bullish momentum. Currently, BTCUSDT is trading above the 62,000 Buyer Zone while remaining below the 64,500 Seller Zone and the descending trendline. The latest rebound suggests buyers are attempting to defend support, but resistance continues to cap the upside. As long as BTCUSDT remains below the 64,500 Seller Zone and the long-term descending trendline, the bearish scenario remains valid. A rejection from current levels could push price toward the 62,000 Buyer Zone (TP1). However, a breakout above 64,500 and the descending trendline would weaken the bearish outlook and favor a stronger bullish recovery. Please share this idea with your friends and click "Boost" 🚀