Bitcoin Price Structure Explained | BTCUSD 15M Analysis
Bitcoin / U.S. dollar BITSTAMP:BTCUSD
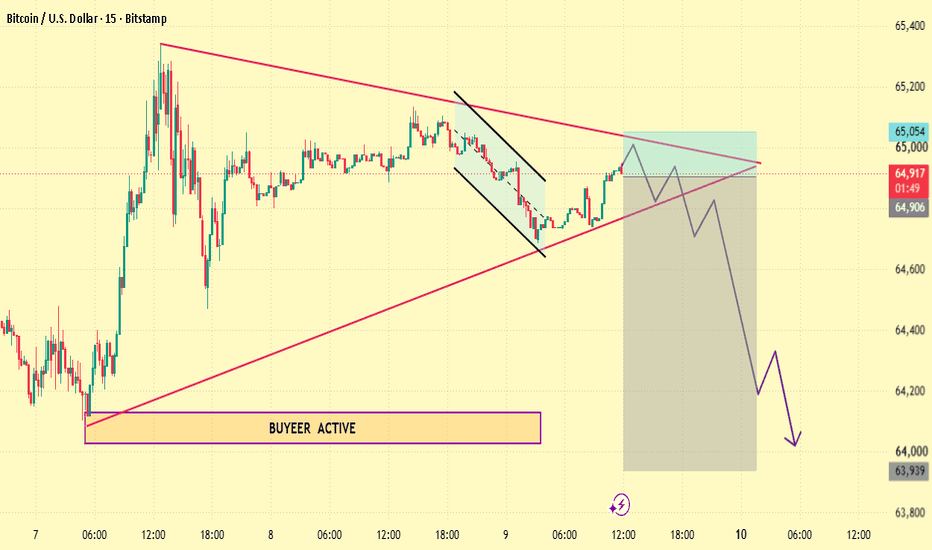
The most visible feature on this chart is the ascending trendline. Price has repeatedly respected this line while creating higher lows.
However, technical structure should always be viewed together with resistance. The 65,350–65,400 area has been marked as a major resistance zone, so price reaction around this region is important.
Technical Areas
Dynamic Support
Rising trendline around 64,800–65,000
Horizontal Support
64,600
64,300
64,100
Resistance
65,000
65,200
65,350–65,400