

YBUSDT — Major Descending TrendLine Breakout Incoming?
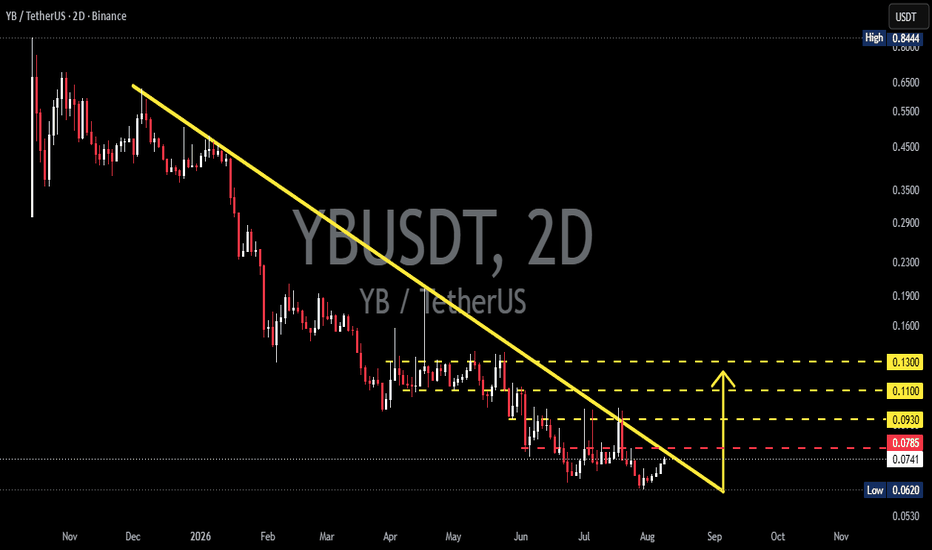
🔎📊 CHART ANALYSIS
🟡 YB/USDT is still under bearish pressure, and the price action since late 2025 appears to be forming a structure of Lower Highs (LH) 📉 and Lower Lows (LL) 📉.
📉 The Descending TrendLine is acting as the main dynamic resistance 🔴, continuously putting pressure on price. Several attempts to move higher 📈 have resulted in rejections ⛔ near this trendline.
🟢 The current price is around $0.0739, relatively close to the $0.0785 resistance 🔴 and the Descending TrendLine 📐.
⚠️ $0.0785 is an important level because a breakout 🚀 above it could be an early indication that bearish pressure is starting to weaken 📉➡️📈.
---
📐🔻 PATTERN: DESCENDING TRENDLINE
🔻 The Descending TrendLine is formed by a series of Lower Highs 📉, connected through a downward-sloping resistance line.
📌 As long as price remains below the trendline ⬇️, the overall structure remains bearish 🔴.
🔥 However, if a 2D candle successfully breaks out 🚀 and closes strongly above the Descending TrendLine, the market structure could potentially shift from bearish 🔴 to bullish 🟢.
🔄 After the breakout, a retest 🔁 of the trendline could provide additional confirmation that the previous resistance has turned into support 🟢.
---
🟢🚀 BULLISH SCENARIO
🚀 The bullish scenario becomes increasingly valid if YB breaks above the Descending TrendLine 📐 and clears $0.0785 🔓.
✅ Stronger confirmation:
🟢 Breakout above the Descending TrendLine 🚀
🟢 2D candle close 📊 above resistance
🟢 Price holds above $0.0785 💪
🔄 Successful retest with the former resistance becoming support 🛡️
🎯🚀 BULLISH TARGETS
🥇 $0.0930 → 🎯 First target / next resistance
🥈 $0.1100 → 🎯 Second target
🥉 $0.1300 → 🎯 Major target shown on the chart
📈 If $0.1300 💥 is successfully broken with strong momentum, the bullish structure could become significantly stronger 🔥, potentially opening the way toward higher resistance levels 🚀.
---
🔴⚠️ BEARISH SCENARIO
⚠️ If YB fails to break the Descending TrendLine 📐 and receives another rejection ⛔, bearish pressure is likely to remain dominant 🔴.
🔻 $0.0785 is a key resistance 🚧. A strong rejection from this area could send price lower again 📉.
📉 If the support around $0.0739 fails ❌, price could potentially revisit the previous low area 🔻.
🎯🔻 BEARISH LEVELS
🔻 $0.0739 → 🛡️ Current/support area
🔻 $0.0620 → 🛡️ Major support / recent low
🔻 $0.0530 → ⚠️ Lower support if $0.0620 breaks
🚨 A break below $0.0620 would be a stronger bearish signal 🔴📉 and could potentially extend the current downtrend ⬇️.
---
🎯👀 KEY LEVELS TO WATCH
🟢 $0.0785 → 🚀 Breakout confirmation area
🟡 $0.0930 → 🎯 First bullish target
🟡 $0.1100 → 🎯 Second bullish target
🟡 $0.1300 → 🚀 Major bullish target
🔴 $0.0739 → 🛡️ Current/support area
🔴 $0.0620 → 🧱 Major support
🔴 $0.0530 → ⚠️ Bearish continuation level
---
🧠📊 MARKET OUTLOOK
📊 Overall Trend: 🔴 Bearish
📐 Pattern: 🔻 Descending TrendLine
⚔️ Key Battle: $0.0785 🆚 Descending TrendLine
🚀 Bullish Trigger: Breakout + 2D close 🕯️ above the trendline
🎯 Bullish Targets: $0.093 → $0.110 → $0.130 🚀
🔻 Bearish Trigger: Rejection + loss of $0.0739 / $0.0620 📉
---
💡🔥 CONCLUSION
📊 YB is currently in a very interesting area to watch 👀, as price is approaching the major resistance 🔴 that has been suppressing price for several months.
⚠️ Do not consider a breakout based only on a wick 🕯️❌ — a confirmed 2D candle close ✅ above the Descending TrendLine would provide a stronger signal 💪📈.
🚀 VALID BREAKOUT = POTENTIAL STRUCTURE SHIFT 📈🔥
⚠️ REJECTION = BEARISH TREND CONTINUES 📉🔻
🎯 Patience + Confirmation = Better Setup 🧠📊
