USD/JPY ($USDJPY) Daily: Long-Wick Indecision Candle
USD/JPY (

 USDJPY
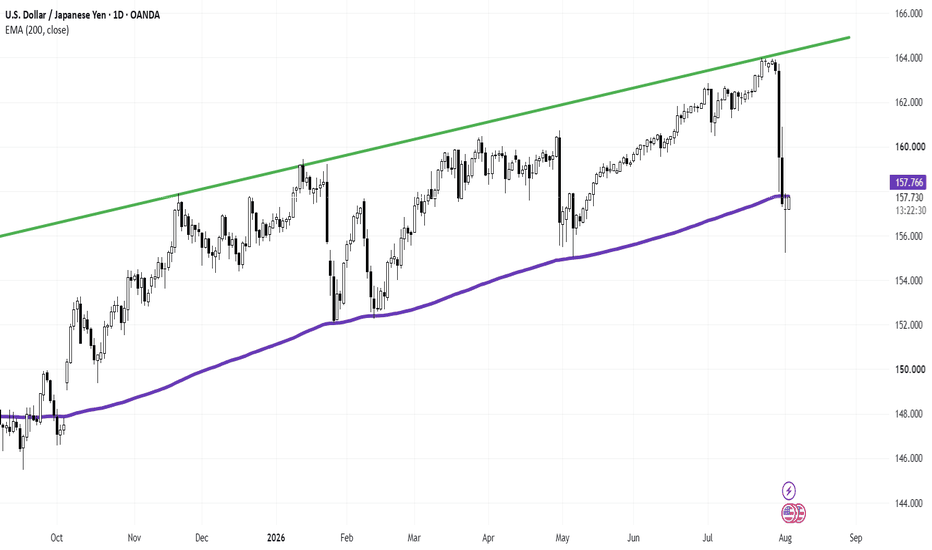
) Daily: Long-Wick Indecision Candle At 200-EMA Highlights Potential Rebound Off 157.76 Support
USDJPY
) Daily: Long-Wick Indecision Candle At 200-EMA Highlights Potential Rebound Off 157.76 Support
### 🇺🇸/🇯🇵 U.S. Dollar / Japanese Yen (
USDJPY
) Daily Technical Framework (Ref: USDJPY_2026-08-04_08-32-51.png)
We are releasing a Daily (1D) technical update on
USDJPY
following a violent multi-day sell-off originating from the channel resistance line (green top baseline near 164.000). The severe downside momentum has collided directly into the major institutional baseline, resulting in clear signs of sell-side exhaustion.
The currency pair is currently stabilizing at **157.643 (+0.28%)**, hovering precisely around its **200-period EMA (157.765)**.
---
### 🔍 Technical Architecture & Indecision Candle Analysis:
Our quantitative framework focuses on the structural significance of yesterday's candlestick pattern at a key moving average node:
1. **200-EMA Institutional Test (Purple Line):** After dropping vertically from the **164.000** peak, price action breached the **200-period EMA (157.765)** intraday, sweeping liquidity down toward lower support levels.
2. **Yesterday's Indecision Candle (Doji / Long Lower Wick):** Yesterday's daily session closed as a classic indecision candle (spinning top/Doji) featuring a significant lower wick. This proves that sell-side momentum encountered aggressive buy-side absorption precisely at the **157.765** dynamic support line, preventing a structural breakdown.
3. **Macro Ascending Channel Wall (Green Line):** The upper boundary of the macro channel continues to cap long-term upside, making the **157.765** level the central decision zone for medium-term bias.
---
### 🛣️ Strategic Operational Pathways:
* **Scenario A — Bullish Mean Reversion Rebound:** Holding above the **157.765** (200-EMA) baseline on a daily closing basis validates yesterday's indecision candle as a exhaustion pivot. This scenario triggers a corrective rally back toward intermediate supply targets at **160.000** and **162.000**.
* **Scenario B — Bearish Breakdown Extension:** A decisive daily candle close below yesterday's low would invalidate the 200-EMA support, opening downside exposure toward secondary structural support floors at **154.000** and **152.000**.
### 📊 Tactical Parameters Summary:
* **Current Bias:** Neutral / Bullish Rebound Defense at 200-EMA
* **Key Dynamic Support Anchor:** 157.765 (200-EMA)
* **Immediate Resistance Target:** 160.000
* **Secondary Overhead Target:** 162.000
* **Downside Breakdown Level:** 155.000
---
📊 **ChartPro Data**
*FX Market Microstructure, Dynamic EMA Anchors & Systematic Risk Management.*
⚠️ **Disclaimer:** For educational and informational purposes only. This active market study represents a personal trading framework and does not constitute financial or investment advice.