US100 Market Intelligence | Statistical Outlook - 03/08/2026
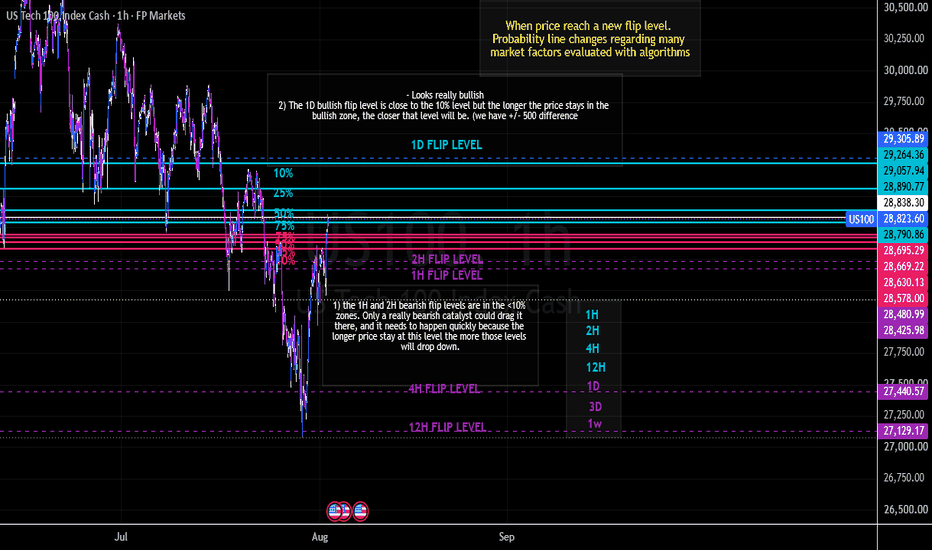
US100 Market Intelligence | Statistical Outlook
The current statistical structure continues to favor the bulls.
Key observations
🟦 Bullish structure remains intact
Price continues to trade above the most important higher-timeframe transition levels, preserving the current bullish market structure.
🟦 Daily Flip Level
The 1-Day bullish flip level is currently located close to the historical 10% probability zone.
This does not imply price must revisit it. Instead, it indicates that historically only a small percentage of bullish regimes required a move that deep before continuing higher.
As long as price remains constructive, the Daily Flip Level will gradually move lower. For example, we have a distance of 500 points with the 1D flip levels to get bullish and enter in a new probabilistic state. If price stays at least into our zone for a good moment, that level could get lower at maybe 400 point distance which bring it into the 10-25% zone. That zone is realistically attainable with enough buying volume. Lets if bulls can bring it there.
🟪 1H & 2H Bearish Flip Levels
The 1H and 2H bearish flip levels are also positioned inside their historical <10% probability zones.
Reaching these levels would require a meaningful bearish catalyst accompanied by sustained selling pressure.
Additionally, these flip levels are dynamic rather than static. The longer price continues to trade sideways or higher, the lower these bearish flip levels migrate (on the short term, of course), making them progressively more difficult to reach without a decisive change in market sentiment.
Current statistical interpretation
Higher-timeframe structure remains bullish.
Bearish flip levels remain statistically distant.
Daily bullish regime continues to strengthen as time passes.
Only a significant bearish catalyst would currently threaten the prevailing trend.
This analysis is generated using the M.I. Quant Market Intelligence engine, which combines multi-timeframe statistical probability models, MACD transition analysis, and historical market-state research to evaluate current market conditions.