SOLUSDT - Bear Flag, Is a Breakdown?
📊 Technical Analysis
💰 Coin:
 SOL
#SOL
SOL
#SOL
⏳ Time Frame: 1D
📉 Pattern: 🐻 Bear Flag
━━━━━━━━━━━━━━━━━━━━━━
🐻📉 What's Happening?
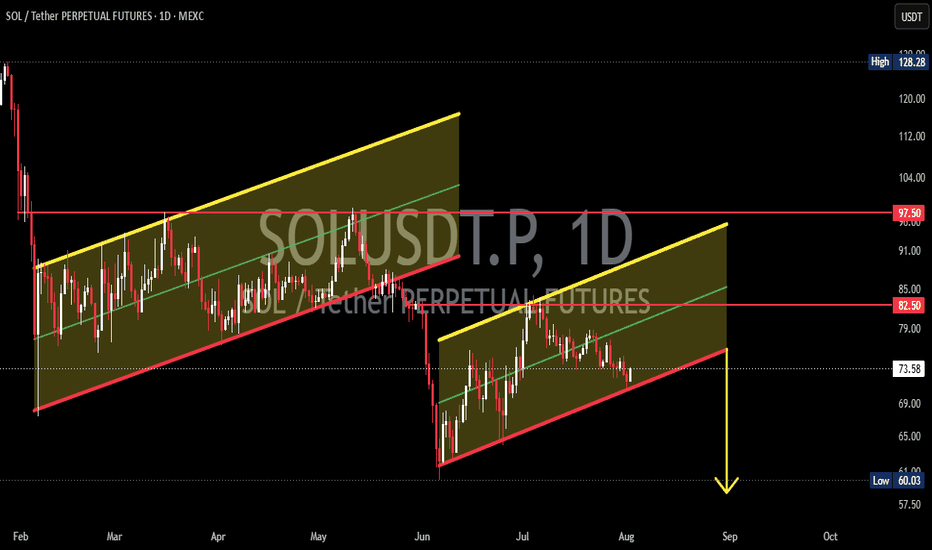
The SOL/USDT chart is currently forming a 🐻 Bear Flag, a classic bearish continuation pattern that typically appears after a sharp decline (🚩 Flagpole), followed by an upward consolidation within an Ascending Channel before potentially continuing its downward trend.
📌 What we can see on the chart:
🔻 A strong 🚩 Flagpole was formed after the sharp sell-off in early June.
📈 Since then, price has been moving gradually higher within an 📐 Ascending Channel, creating a 🐻 Bear Flag pattern.
⚠️ Price is now approaching the 🔴 Lower Trendline, which is the most critical area to determine the next major move.
📉 The overall market structure continues to form Lower Highs, indicating that sellers remain in control.
💥 So far, there is no strong bullish signal capable of reversing the primary bearish trend.
🎯 As long as the price remains inside this pattern, selling pressure continues to dominate.
━━━━━━━━━━━━━━━━━━━━━━
🐻📉 Bearish Scenario (Higher Probability)
⚠️ If the price breaks down and closes below the Lower Trendline of the Bear Flag, the pattern could be officially confirmed.
📏 The downside target is typically measured using the height of the 🚩 Flagpole, suggesting there is still significant room for further correction.
🎯 The nearest major support is located around 🟢 $60, which also corresponds to the previous swing low.
📊 A breakdown accompanied by strong trading volume would significantly increase the probability of a continued bearish trend.
🔻 Unless key resistance levels are reclaimed, sellers are expected to maintain control.
━━━━━━━━━━━━━━━━━━━━━━
🟢🚀 Bullish Scenario
✅ A bullish scenario will begin to develop if the price can:
📈 🟢 Hold above the Lower Trendline of the Bear Flag.
🚀 📊 Break above the Upper Channel Resistance.
💪 🔥 Successfully break through the key resistance around 🔴 $82.50.
🎯 🚀 A much stronger bullish confirmation would occur if the price reclaims 🔴 $97.50, invalidating the 🐻 Bear Flag pattern.
⚠️ Until those breakout confirmations occur, any upward movement should still be considered a 📈 Relief Rally within the broader bearish trend.
━━━━━━━━━━━━━━━━━━━━━━
📍🎯 Key Levels
🟢 Major Support: ≈ $60
🔴 First Resistance: $82.50
🚧 Major Resistance: $97.50
━━━━━━━━━━━━━━━━━━━━━━
📌⚠️ Conclusion
📉 The Bear Flag remains the dominant pattern on the Daily Time Frame.
🐻 As long as the price continues trading within the channel and fails to break above the major resistance levels, the probability of a Breakdown remains higher than that of a Breakout.
👀 Traders should closely monitor the 🔴 Lower Trendline, as this area could determine SOL's next major directional move.
✅ Always wait for candle close confirmation and trading volume before making any trading decisions.
━━━━━━━━━━━━━━━━━━━━━━
#SOL #SOLUSDT #BearFlag #Bearish #TechnicalAnalysis #TradingView #Crypto #CryptoTrading #PriceAction #Altcoins #Support #Resistance #ChartAnalysis #CryptoMarket