SMCI Daily — Structure Before the Move
SMCI is one of those charts where the more I look at it, the less interested I am in trying to predict the next candle and the more interested I am in mapping the structure around it.
Right now, I don’t particularly love the setup.
That could change fairly quickly.
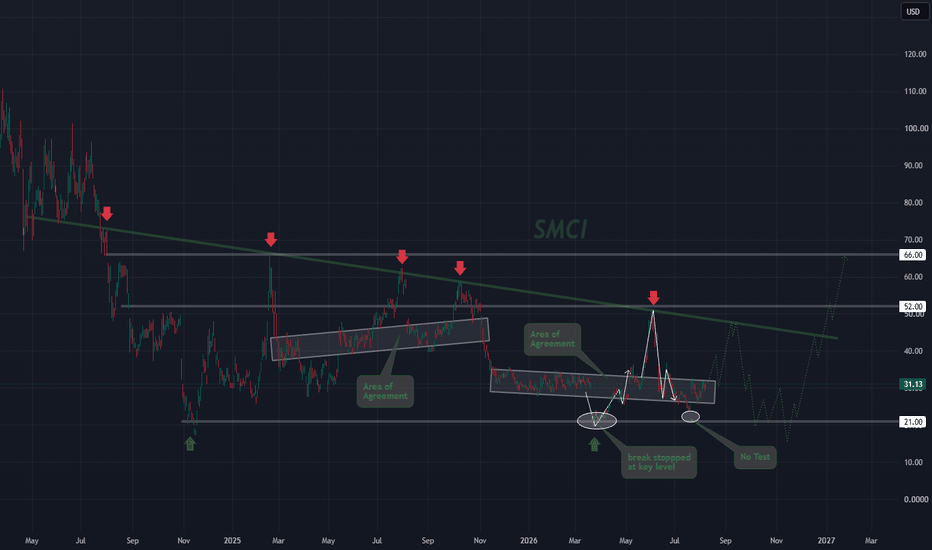
The larger daily structure still has SMCI trading beneath a long-running downward-sloping trendline, and that line has repeatedly mattered. I marked the major reactions with red arrows because each one helps establish that this is not a line I drew just because it looked convenient. Price has tested that general declining structure multiple times and repeatedly failed to establish itself above it.
That makes any future approach worth paying attention to.
The major horizontal levels
I have two larger horizontal reference areas marked at approximately $52 and $66.
The $52 area is especially important to me because it overlaps with the descending structure and has repeatedly acted as a meaningful decision area.
That creates a form of confluence I care about much more than any single line by itself.
A break of the diagonal trendline would be interesting.
A break of the trendline plus a successful reclaim of $52 would mean substantially more to me.
The $66 area sits above that as the next larger structural reference.
The first Area of Agreement
The first marked Area of Agreement developed during the earlier consolidation phase before price pushed higher.
This is important because it helps illustrate something I think gets overlooked in TA:
The best-looking move isn’t necessarily the best trade. Structure before the move is what can make it tradable.
That first violent spike on the left side of the chart was impressive, but catching something like that cleanly either direction would have required a tremendous amount of anticipation.
The later move was different.
After SMCI had already developed recognizable structure, price pushed sharply higher into the declining trendline and the broader resistance area.
That gave traders something much more useful: context.
Instead of guessing where a vertical move might stop, there was an established structural area where rejection actually meant something.
The extended Area of Agreement
I extended the more recent Area of Agreement because it did not really become meaningful until after the first rejection from the descending trendline.
That matters.
Price rejected the larger trend structure, dropped back down, and then began establishing a more defined range beneath it.
That range has now become its own reference structure.
To me, this is much more useful than simply labeling the entire region as chop.
It gives us a defined area where price has repeatedly found acceptance and where future expansion could begin.
The $21 level
The lower horizontal area around $21 is the clearest major support reference on this chart.
We’ve already seen an attempted break below that area get stopped and reversed.
I marked that because a failed breakdown at a major level can be just as informative as a successful breakout.
That said, I would not assume $21 automatically holds forever.
The more recent test did not actually reach the level, which is why I specifically labeled it “No Test.”
That distinction matters to me.
Close is not the same thing as tested.
What I think could happen next
The green dotted path is not a prediction.
It is one possible structural development I can imagine from here.
If SMCI eventually works its way back toward the descending trendline, I would not be surprised to see multiple attempts before any meaningful breakout.
That area carries too much prior history for me to assume price simply slices through it on the first try.
A rejection followed by consolidation, another test, and eventual breakout would make structural sense.
So would another failure.
That is why I am not particularly excited about the setup at approximately $31 right now.
It is sitting between more meaningful decision areas.
Bullish scenario
A bullish development would begin with SMCI continuing to build above the lower structure and eventually pressing toward the descending trendline.
A break above the diagonal would get my attention.
A reclaim and hold above $52 would get considerably more of it.
From there, $66 becomes the next major structural area I would watch.
Neutral scenario
SMCI may simply remain trapped inside this broader structure.
There is plenty of room for price to continue rotating between the lower support region and the overhead resistance without establishing a meaningful longer-term trend.
That is probably the scenario I am most interested in respecting until price proves otherwise.
Bearish scenario
Failure of the current structure brings the lower portion of the range back into focus.
A proper retest of $21 would be important.
A clean breakdown and acceptance below it would materially change the chart and invalidate much of the constructive scenario shown here.
What I’m watching
Right now I am less interested in choosing a direction than I am in watching how price behaves as it approaches these established structures.
The chart already gives me the reference points.
Now price has to tell me which ones actually matter next.
That is the value of mapping this beforehand.
Not predicting every move.
Just making sure the next major move does not arrive without context.