NIFTY 50 — Symmetrical Triangle Breakout
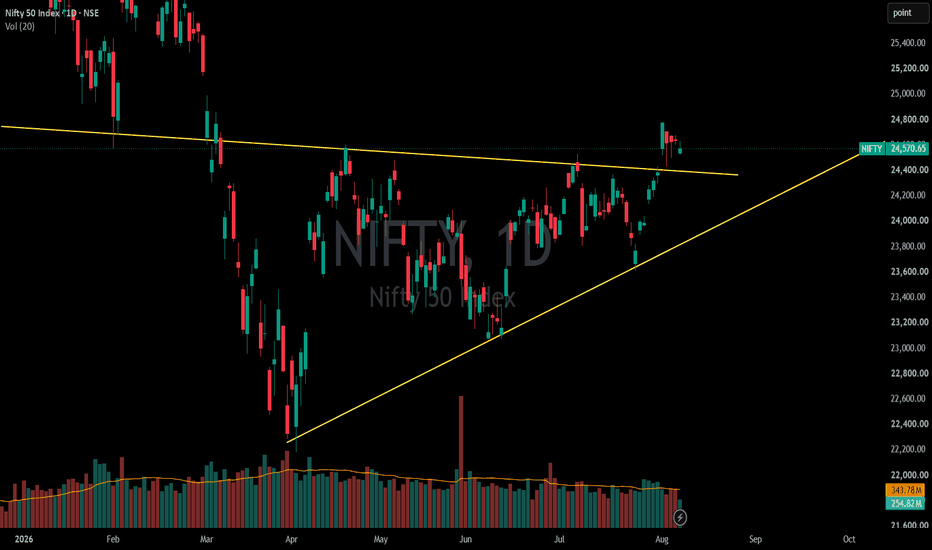
📊 NIFTY 50 — Symmetrical Triangle Breakout Attempt
NIFTY 50 is currently at a critical technical juncture, showing a potential breakout from a multi-month Symmetrical Triangle formation on the Daily timeframe.
The structure has been developing through a series of higher lows from the April bottom, while the upper boundary has formed a descending resistance trendline, creating a clear compression pattern.
Price has now moved above the descending trendline and is trading around 24,570, indicating an initial breakout attempt.
However, the breakout still requires confirmation through sustained price action and volume. The current volume appears relatively moderate compared with its 20-day average, so chasing the initial breakout may carry the risk of a false move.
🔑 Key Levels
Bullish Confirmation:
A sustained move and daily close above 24,450–24,500 could strengthen the breakout and potentially open the way toward:
24,800 → 25,200 → 25,500 → 26,000+
A successful completion of the triangle's measured move could potentially project toward the 26,500–26,900 zone.
Bearish Failure:
If Nifty falls back below the 24,400–24,500 breakout zone and closes below it, the current breakout could turn into a false breakout.
In that scenario, the rising trendline becomes important, with potential downside levels around:
24,000 → 23,600 → 23,200
📈 My View
Structure: Bullish breakout attempt
Trend: Improving
Volatility: Contracting → potential expansion
Volume: Needs confirmation
Bias: Bullish above 24,500; cautious below the breakout zone
The pattern itself doesn't predict the direction — price confirmation does.
I would therefore wait for a sustained breakout/retest rather than anticipating the move.