KGENUSDT — Symmetrical Triangle Ready to Determine the Next Move
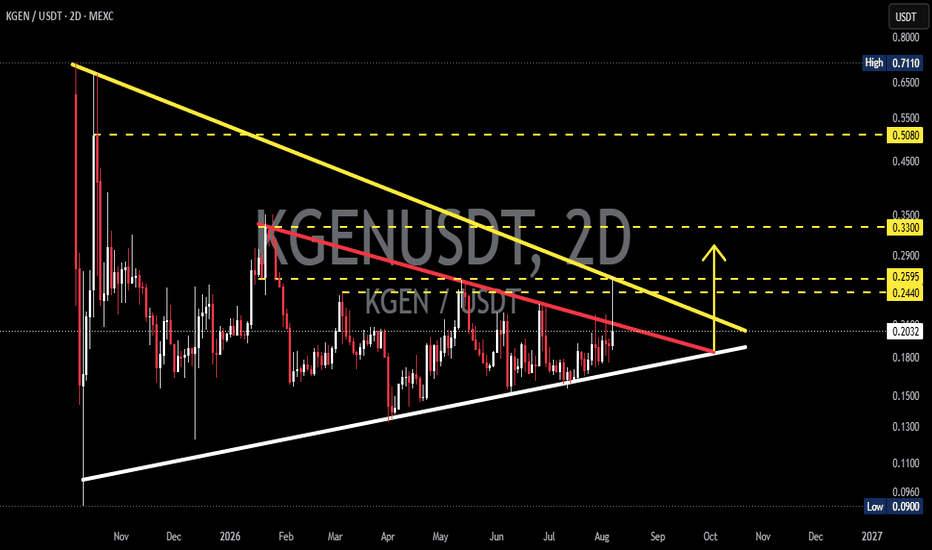
📊 Technical Analysis — KGEN/USDT
⏳ Time Frame: 2D
💰 Current Price: around $0.2059
📈 Pattern: Symmetrical Triangle + Descending Resistance
🎯 Potential Targets: $0.244 → $0.2595 → $0.333 → $0.508
---
🔎 Chart Structure
🔺 KGEN is forming a Symmetrical Triangle pattern, visible through two converging trendlines:
🟡 Descending Resistance — the main resistance line is trending downward from the $0.711 area and continues to pressure the price.
⚪ Ascending Support — the support line is gradually moving upward, showing that buyers are progressively defending higher price levels.
🔴 Inner Descending Trendline — there is an additional descending resistance line currently acting as one of the nearest obstacles for price.
📌 The combination of lower highs + higher lows indicates consolidation and increasing pressure between buyers and sellers. As price approaches the apex, the probability of a breakout or breakdown increases.
---
🟢 BULLISH SCENARIO
🚀 The bullish scenario becomes increasingly valid if KGEN breaks out and closes a candle above the descending resistance.
🔥 A breakout above the red resistance line would be an early signal that bearish pressure is weakening.
📈 If the price breaks the main resistance with increasing volume, the potential for a move toward the next resistance levels becomes stronger.
🎯 Bullish Targets:
🥇 $0.244 → First target/resistance
🥈 $0.2595 → Next resistance
🥉 $0.333 → Major breakout target
🚀 $0.508 → Extended target if bullish momentum becomes very strong
💡 From the current price around $0.2059, reaching $0.244 would represent approximately +18.5%, while $0.2595 would be around +26%.
🔥 If the breakout continues toward $0.333, the potential upside would be approximately +61.7% from $0.2059.
⚠️ However, the higher the target, the more important breakout confirmation and volume become.
---
🔴 BEARISH SCENARIO
⚠️ The bearish scenario becomes dominant again if KGEN fails to break the resistance and subsequently loses the ascending white support line.
📉 A breakdown below the white support line could confirm that the higher-low structure is beginning to break down.
🔻 If the support is broken with a clear candle close and increasing volume, the price could continue correcting toward previous support areas.
🎯 Potential Bearish Areas:
🔻 $0.18 → Immediate support
🔻 $0.15 → Next support
🔻 $0.13 → Lower support
🔻 $0.11 – $0.10 → Stronger historical support area
🚨 If the price completely loses the triangle structure, the bullish breakout setup would become invalid and selling pressure could increase again.
---
🧩 Pattern Explanation
🔺 A Symmetrical Triangle typically forms when buyers and sellers become increasingly balanced, causing the price range to gradually narrow.
🟢 Higher Lows indicate that buyers are still defending progressively higher levels.
🔴 Lower Highs indicate that sellers are still actively pushing the price down from above.
⚡ This creates price compression — as the range becomes tighter, a breakout from either side of the triangle becomes increasingly important.
📌 Upside breakout = bullish confirmation.
📌 Downside breakdown = bearish confirmation.
---
🎯 KEY LEVELS
🟢 Bullish Breakout Area: $0.244 → $0.2595
🚀 Major Target: $0.333
🔥 Extended Target: $0.508
🔴 Immediate Support: around $0.18
⚠️ Lower Support: $0.15 → $0.13
🛡️ Major Support Zone: $0.11 → $0.10
---
🧠 Conclusion
⚡ KGEN/USDT is currently in a consolidation phase within a Symmetrical Triangle structure.
🔺 Buyers continue to form higher lows, while sellers are maintaining the descending resistance.
👀 As price approaches the apex of the triangle, a breakout from this structure could become a catalyst for a larger move.
🟢 Bullish: breakout + candle close above resistance + increasing volume → potential move toward $0.244 → $0.2595 → $0.333.
🔴 Bearish: rejection + breakdown below ascending support → risk of a correction toward $0.18 → $0.15 → $0.13.
⚠️ The key factor is not simply whether price touches the resistance/support, but how the candle closes and whether the breakout is supported by strong volume.
---
#KGEN #KGENUSDT #Crypto #CryptoAnalysis #TechnicalAnalysis #CryptoTA #TradingView #Altcoin #AltcoinAnalysis #SymmetricalTriangle #TrianglePattern #Breakout #Bullish #Bearish #CryptoTrading #PriceAction