How Much Longer Can Gold Stay Trapped in This Range?
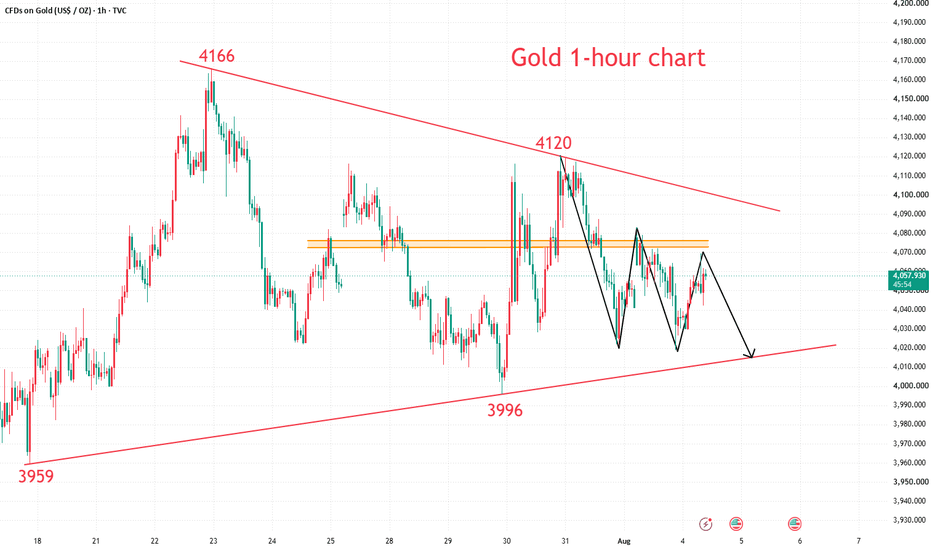
Gold Technical Analysis: Yesterday's movement—dipping to a low before rebounding—reflects the prevailing market state: oscillation. While overall highs are lowering and lows are rising, the downward drift during the Asian and European sessions did not signal weakness; consequently, the fact that the US session decline failed to break the previous low of 4020 made it an excellent spot to initiate long positions—an application of "strength vs. weakness" theory regarding key levels. On the daily chart, the trend remains a downward oscillation; bears continue to suppress bulls, maintaining the cycle of alternating bearish and bullish candles.
On the 1-hour chart, the price remains within a converging triangle range of 4020–4100. Breaking out of this range requires time, or a catalyst—such as this week's ADP, Initial Jobless Claims, or Non-Farm Payrolls data—to disrupt the established pattern of converging oscillation. Overall, the short-term strategy for gold favors selling on rallies and buying on pullbacks. Key resistance levels to watch are 4070–4100, while key support levels are 4020–4000.
Gold Trading Strategy Reference:
Short Position Strategy:
Strategy 1: Sell (go short) in batches near 4070–4080 (allocating 20% of the position); set stop-loss at 4100; target 4050–4030, with a potential further drop to the 4020 level if the support breaks.
Long Position Strategy:
Strategy 2: Buy (go long) in batches near 4010–4020 (allocating 20% of the position); set stop-loss at 3990; target 4040–4060, with a potential further rise to the 4070 level if the resistance breaks.