

Weekly Outlook (Second Week of August 2026)
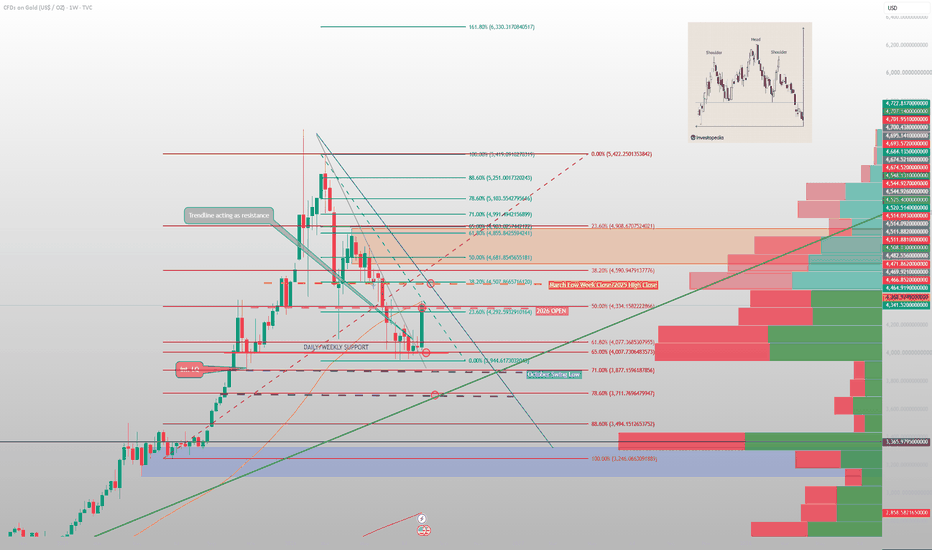
🟡 Gold (XAU/USD) Weekly Technical Forecast
Gold has finally made the move we’ve been waiting for and as outlined in the last weekly outlook.
After spending roughly six weeks consolidating near the yearly lows, XAU/USD has broken decisively to the upside, with the rally now extending more than 10% from the yearly low. This is the strongest weekly advance we’ve seen since January and, more importantly, the breakout has taken price through a major technical pivot zone.
For me, this is an important change in the structure. Gold is no longer simply trading sideways near the lows. The breakout has shifted attention toward the broader yearly downtrend, with the next question being whether buyers can maintain control and turn this recovery into something more significant.
The six-week consolidation was essentially a period of compression after the sharp decline earlier in the year. Price has now broken above that range and, importantly, has managed to touch the 50-week moving average for the first time since June. Weekly close above the 50-week moving average would have given the breakout more significance from a higher-timeframe perspective. Therefore, the first major hurdle I’m watching is the 4320–4335 area, as we have several technical factors coming together here - the yearly open, the 50-week moving average, 23FIB. Because several levels converge in this region, I want to see how price behaves around it.
While the daily timeframe is showing strong bullish momentum, the weekly timeframe hasn't yet reached the kind of momentum that would make me completely comfortable calling this a confirmed long-term reversal.
That's why I want to see follow-through this week.
The breakout is bullish, but the confirmation comes from what price does after the breakout.
If gold can hold above the previous range resistance and continue printing higher highs and higher lows, the probability of a larger recovery increases significantly.
🎯 Key Resistance Levels
4320–4335 — First Major Resistance
This is the immediate level I’m watching.
It's particularly important because of the convergence between the yearly open, 50-week moving average and multiple trend-channel levels. If gold can establish acceptance above this zone on a weekly basis, I would consider that a much stronger confirmation that buyers are taking control.
4490–4530 — Major Resistance / Battle Zone
This is the big one. The region is supported by several technical factors:
- March low-week close
- 38.2% Fibonacci retracement of the March decline
- 2025 high close
- Upper parallel of the yearly downtrend
With all of these levels converging around the same region, I would expect a potentially significant reaction if gold reaches this area.
This is why I wouldn't simply assume that a breakout above 4319 automatically means gold runs straight to new highs.
Around 4500, we could see sellers step back in. For me, this is the area where I want to see how price reacts rather than blindly chasing the move.
4855–4894 — Higher-Timeframe Resistance
If gold manages to clear 4490–4530 and establish a new leg higher, the next major area comes in around 4855–4890.
This zone incorporates the 61.8% Fibonacci retracement of the March decline as well as the record high-week close.
That would be a much more significant recovery target and would indicate that gold has moved considerably further away from the bearish structure that dominated earlier in the year.
🛡️ Key Support Levels
The breakout is only as strong as the levels that hold underneath it.
4175 - 4180 — First Key Support
This is now my first major level of interest.
4175 represents the yearly low-week close and sits close to the breakout structure. From a trading perspective, if gold is going to continue higher on this stretch, I want to see 4175 hold.
A pullback into this area would not necessarily be bearish. In fact, a successful retest followed by a bullish reaction could provide much stronger confirmation that the breakout is legitimate.
4000–4020 — Major Support Zone
This zone contains the late-October and July low-closes and would be an important test if the current breakout fails. A deeper pullback into this area could still leave the broader recovery structure intact, but losing it on a weekly closing basis would significantly weaken the bullish argument.
3887 — Major Downside Level
Below 4000–4020, I'm watching 3880, which corresponds with the October swing low. A move back toward this level would suggest that the current breakout has failed and that sellers are beginning to regain control.
Below there, the lower parallels of the broader structure come into play around 3700.
From a fundamental perspective, the next major event is Wednesday's US CPI report.
The recent weaker-than-expected Non-Farm Payrolls report has already changed the conversation around Fed policy.
Markets have continued to reduce expectations for additional tightening, with Fed funds futures pricing around a 58% probability of the Fed remaining on hold next month.
This is important for gold because the relationship between inflation, Fed expectations, Treasury yields and the dollar can have a significant impact on precious metals.
A softer-than-expected CPI reading could reinforce expectations for a less restrictive Fed and potentially reduce upward pressure on Treasury yields. That would create a more constructive environment for gold and could provide the catalyst needed for XAU/USD to continue higher toward the 4490–4530 resistance zone.
On the other hand, a hotter-than-expected CPI print could push yields and the dollar higher and potentially trigger a short-term correction in gold.
That's why I'm not just watching the CPI number itself. I'm watching the reaction in gold, Treasury yields and the dollar after the release.
📌 My Trading Framework
The way I'm looking at gold here is fairly simple.
The breakout has shifted the short-term structure in favour of the bulls, but I don't want to chase an extended move simply because price has broken out.
The key question is:
Can gold hold above the breakout and continue building higher highs?
If yes, the next major objective becomes 4490–4530.
If price pulls back, 4180 becomes the first level I want to see defended.
A deeper move into 4000–4020 would still be recoverable, but at that point the market would need to prove that buyers are willing to step back in.
A weekly close below 4000–4020 would be a major warning sign and would increase the probability of a move back toward 3880, with the lower channel levels around 3700 becoming relevant.

