
How to Read One Inflation Print Without Predicting Rates
A monthly inflation release should be treated as an observation that updates a scenario—not as a complete rate forecast or a directional trade signal.
1. Separate the headline from its driver
June headline CPI fell 0.4% month over month. Energy fell 5.7% and was the largest contributor to the decline. The first question is not “bullish or bearish?” It is “what produced the move, and what would have to persist?” A volatile component can begin a durable trend; it can also reverse.
2. Check the core and the second gauge
Core CPI was unchanged month over month and up 2.6% year over year. The PCE price index fell 0.1% month over month, while core PCE rose 0.1% month over month and 3.3% year over year. CPI and PCE use different weights and methods. Agreement increases confidence; divergence identifies what still needs explanation.
3. Read the policy distribution
The July 29 FOMC decision held the target range at 3.50%–3.75% by a 9–3 vote. The three dissenters preferred a 25-basis-point increase. That vote is a snapshot, not a promise about the next meeting. It shows why one negative monthly print should not be translated directly into an easing consensus.
4. Write confirmation and invalidation conditions
A disinflation interpretation becomes stronger if multiple core readings remain subdued, cooling broadens beyond volatile categories, labor demand weakens materially, and policy language plus the vote distribution become less restrictive.
It becomes weaker if energy rebounds, core services or shelter regain momentum, growth remains firm while inflation persistence returns, or the policy distribution shifts tighter.
5. Keep the chart subordinate to the process
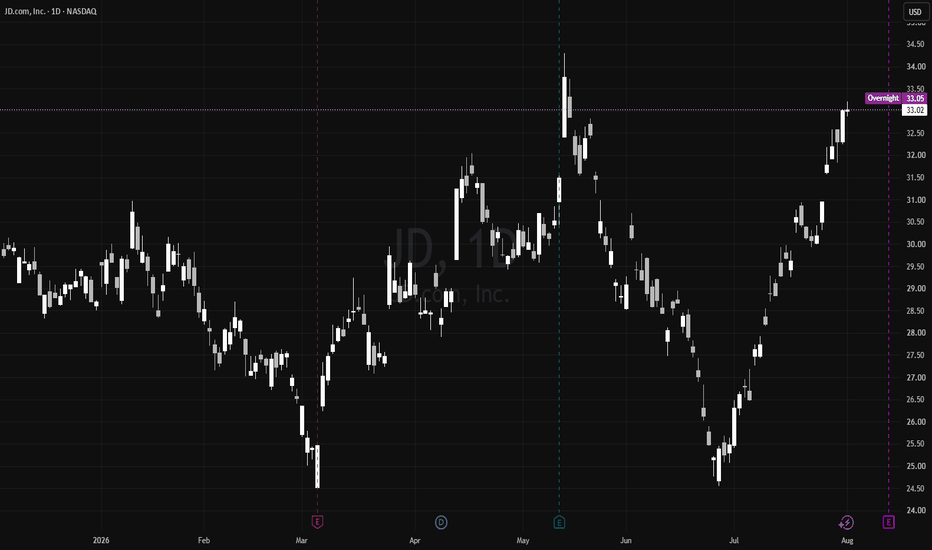
The chart shown is illustrative only. Do not use the next candle to “prove” a macro story or turn this tutorial into a prediction about the displayed symbol. Mark the release time, define the horizon, and keep size, liquidity, and exit rules separate from the narrative.
Educational sequence: driver → persistence → cross-check → policy distribution → invalidation. A new data point can change scenario weights. It should not remove risk controls.
Educational only. This tutorial is not investment advice, a rate forecast, or a directional price prediction. Economic data can be revised or superseded, policy conditions change, and trading involves risk.
Sources: U.S. Bureau of Labor Statistics, U.S. Bureau of Economic Analysis, and the Federal Reserve Board; releases current through August 2, 2026.
