GOOGL | Q3 2026 - Day Chart
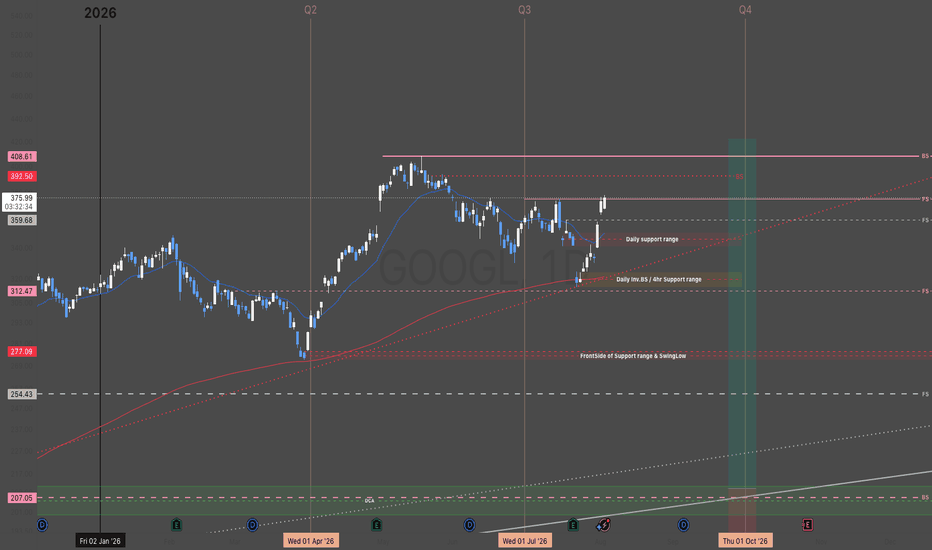
Alphabet Inc (Google) Class A ||
MARKET-BEATING SCORE = 8/10
Dividend yield (indicated)
0.24%
"a holding company, which engages in the business of acquisition and operation of different companies. "
-----------------------------------
PEGY 0.21 — undervalued vs growth. Strong market beater.
EPS growth 90.5% — above-market.
Revenue growing 21.8% YoY — strong.
Gross margin 60.9% — strong moat.
FCF margin 5.1% — real cash generation.
D/E 18.86 — high leverage.
-----------------------------------
Alphabet faces significant disruption risks from ongoing antitrust litigation and global regulations like the EU's Digital Markets Act, which may force the removal of exclusive search deals and alter data-sharing practices (https://finviz.com/news/142732/alphabet-googl-discount-tied-to-regulatory-risk-but-analyst-sees-upside) (https://nova.kapualabs.com/goog-sys_onboarding/alphabets-228-case-legal-matrix-a-comprehensive-risk-assessment). While the company has integrated generative AI through Gemini to counter rivals like Microsoft and OpenAI, these technologies still pose a structural threat to traditional search advertising revenue and organic traffic (https://www.kalkine.com/news/technology/alphabet-googl-stock-analysis-2026-gemini-search-and-the-ai-first-future) (https://www.ainvest.com/news/alphabet-long-term-risks-navigating-ai-disruption-regulatory-headwinds-intensifying-competition-2511). Additionally, intense competition in the cloud sector and potential supply chain vulnerabilities in hardware further complicate the growth outlook over the next two years (https://s206.q4cdn.com/479360582/files/doc_financials/2025/q4/GOOG-10-K-2025.pdf) (https://tldrfiling.com/stocks/GOOGL).
Risk Level:
Moderate
----------------------------------
POSITIVE CATALYST OUTLOOK
"Could a policy change or competitor headwinds create a positive catalyst in the next 2 years?"
Alphabet is positioned to benefit from the resolution of regulatory uncertainty, as recent court rulings have rejected some extreme remedies and preserved key distribution partnerships (https://finance.yahoo.com/news/googl-rises-favorable-antitrust-ruling-162600738.html). The company holds a significant cost advantage over rivals through its proprietary TPU hardware, which reduces AI training expenses compared to GPU-dependent competitors (https://matrixbcg.com/blogs/competitors/abc). Furthermore, Google Cloud's accelerating growth—recently outpacing Azure—and the integration of Gemini across its massive ecosystem provide a formidable moat against emerging AI search threats (https://seekingalpha.com/article/4902412-alphabet-buy-ahead-of-a-strong-catalyst).
Positive Outlook:
Moderate
-----------------------------------
Multiple Time-Frame Analysis; Color Code | Strength favors the higher timeframe.
Yearly timeframe = black
Monthly timeframe = pink
weekly = grey
daily = red
4hr = orange
1hr = yellow
15min = blue
5min = green if they are shown. (Level visibility on intervals is set to timeframe the level was found on and below to keep chart view organized.)
** Candle Science explained **
A Range = two or more consecutive color candles.
There are two types of ranges - accumulation and distribution. **A single candle is a range on a lower timeframe. *Find the range and define its, creation dates, prices, and risk parameters. A range is broken down into 4 candle, which create 6 levels that define the range and illustrate market structure.
Focus only on the first and last candle of each range. The last candle of each type of range has two levels - see FS & Inv. FS Candles below.
DISTRIBUTION RANGES DEFINED:
When price is above a distribution range, these candles/levels act as support.
(BS) BACKSIDE Candle - First distribution candle in a distribution range. Expectation = strong reaction to price. long wicks reaching to or away from level. high angle accumulation trends, f.v,g's
(FS) FrontSide Candle - Last distribution candle in a distribution range. Expectation = reversal, create a low angle accumulation trend. The top of Distribution candles are used as support. The bottom of the FrontSide candle is the SwingLow of the range. The FS candle wants to protect the SwingLow. When/if Price Action closes below the SwingLow, the level is invalidated. Find another range to trade.
ACCUMULATION RANGES DEFINED: When price is below an accumulation range, these candles/levels act as resistance.
INVERSE BACKSIDE (Inv.BS) - First Accumulation candle in an accumulation range. Expectation. = strong reaction to price. long wicks reaching to or away from level. Creates high angle distribution trends, f.v.g, protects the Inv.FS candle
INVERSE FRONTSIDE (Inv.FS) - Last accumulation candle in an accumulation range. Expectation = reversal, create a low angle distribution trend. The bottom of Accumulation candles are used as resistance.
The top of the Inv.FrontSide candle is the SwingHigh of the range. The Inv.FS candle wants to protect the SwingHigh. When/if Price Action closes above the SwingHigh, the level is invalidated. Find another range to trade.