EURO: A 1.1000-1.3000 Box - Read It From the Lower Third
ONE RULE ABOVE EVERYTHING: THE MARKET IS ALWAYS RIGHT
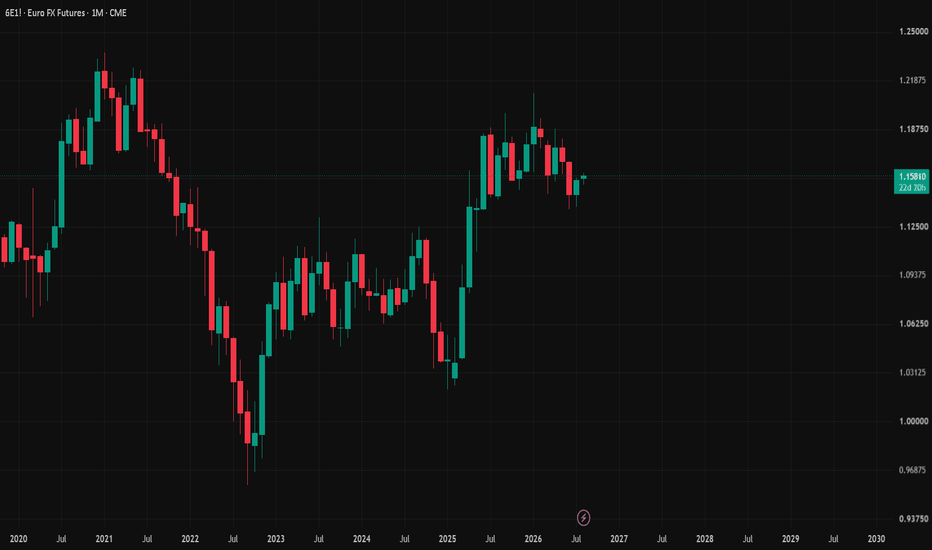
The euro lives inside a very large box: 1.3000 on top, 1.1000 underneath, and it is
trading around 1.1581 - the lower third of that range. Within the last twelve months
the market pushed as high as the 1.2100 area and was sent back down without ever
threatening the ceiling. That failed attempt is not a detail. It is the box showing
you who is in charge.
A box is not a lack of opinion. A box IS the opinion: two currency blocs, two central
banks, and for years the market has priced their argument as a draw inside these
walls. The draw is the fact. Your feeling that it "has to" resolve one way is the
opinion - and every time those two have disagreed, the walls have won. That is what
the market being always right means here: the box stands until a monthly close
removes it, no matter how loud the story of the week is.
This is also the currencies post I promised at the end of the Nasdaq piece. Gold,
Bitcoin, crude, the index - every one of those charts had the dollar hiding inside
it. This chart is where the hidden variable comes out and gets read directly.
Five things follow, and they are the only part of this you should copy:
1. Write the invalidation before the entry. In a box the market drew it for you: the
thesis dies on a close outside the wall you leaned on. If you cannot name that close,
you have a hope, not a thesis.
2. Never argue with a close - only with your own model. Losing money is expensive.
Defending a broken idea is far more expensive, because it also costs you the next ten
trades.
3. Size it so that being wrong is survivable and boring - and in FX this rule counts
double, because leverage is the house style here. The floor is about five percent
away and the ceiling about twelve. Leverage collapses those honest distances into one
bad week, and it will happily do it while your thesis is still technically alive.
4. In a box, act near the walls and do nothing in the middle. The nearest wall right
now is the floor, which is exactly what makes the lower third interesting: risk is
defined a few percent below, while the room above runs all the way to the 1.2100
waypoint before the ceiling is even a conversation. Interesting is not the same as
allowed - the weekly grants permission, not the distance.
5. You are trading two central banks, not one headline. A currency is a ratio. Every
euro position is long one monetary policy and short another, so news from one side
means nothing until you have priced the other side's reply. Single-country analysis
on a two-country instrument is half a chart.
A WIDE BOX IS A SUPERPOSITION WITH PATIENCE
In quantum mechanics a system genuinely holds several outcomes at once, each with a
weight, and the measurement is what forces one of them. A box this wide is exactly
that, running in slow motion.
From 1.1581 three states are live at the same time. A rotation up through the middle,
where the 1.2100 area - the market's most recent failed attempt - is the first real
test. A sag back into the 1.1000 floor, five percent below, where the box itself gets
examined. And the state everyone prices last in a range this old: one of the walls
actually dying on a monthly close, which would not be a trade signal but a regime
change for every dollar-priced chart in this series.
None of these is a prediction. They are weights. My job is not to collapse the state
early by force of opinion - it is to stand where all three resolutions leave me
solvent and thinking.
MONTHLY - THE BOX IS THE REGIME

On the monthly, 1.1000-1.3000 is not noise inside a trend. It is the structure
itself, drawn over years, and both walls are the market's own handwriting. My panel
here is not asking "up or down this month". It is asking whether pressure inside the
box is building toward one wall, and whether each approach arrives with more force or
less - the 1.2100 rejection being the most recent answer.
Read it this way: the monthly decides how seriously to take everything else. Only two
prints change the regime - a monthly close above 1.3000 or below 1.1000. Everything
in between, however dramatic on the day, is rotation inside a market that has already
told you its answer: still a draw.
WEEKLY - PERMISSION, NOT PREDICTION
The weekly is the timeframe that actually trades this box. Rotations across a range
this wide take months, and the weekly close is the only vote I count when deciding
whether the lower third is being accumulated or merely visited.
What I want from the weekly is simple: structure holding on closes above the floor -
higher lows that survive the week, not intraweek heroics. While that holds, the
rotation toward 1.2100 is the working map and dips are entries. The week that closes
through a prior defended low is the week the floor conversation stops being
theoretical - and I want my response written before that week arrives, not during it.
DAILY - EXECUTION, NOT CONVICTION
The daily inside a wide FX box produces the most convincing noise in this business.
Every three-day push looks like the start of the big rotation, every red streak looks
like the floor giving way, and both are usually inventory changing hands where the
most eyes are watching.
I use the daily for sequencing only: where to lean, where to do nothing, and which
daily close warns me the weekly picture is about to be tested. Correct and profitable
are not the same word, and in the middle of a box the daily chart is where that gap
eats accounts fastest.
WHY THE THREE DISAGREE - AND WHY THAT IS NORMAL
In quantum mechanics some measurements do not commute: measuring position precisely
destroys precision in momentum - not because the tools are bad, but because the two
questions are structurally different questions.
Timeframes are exactly that. The monthly asks "what is the regime" and answers: a
draw, boxed for years. The weekly asks "is the lower third being bought". The daily
asks "where exactly do I act". A nervous daily inside a constructive weekly inside a
neutral monthly is not a contradiction to resolve - it is three honest answers to
three different questions. Demand that all three agree and you will act exactly once:
after the move, at the worst price, with the most company.
FUSION READ - A CURRENCY IS PURE ENTANGLEMENT
Entanglement: measure one particle and you have said something about its partner, no
matter the distance. Every chart in this series had that property somewhere. A
currency pair IS that property - it does not even exist alone. There is no euro
price, only euro-versus-dollar, one number carrying two economies. Four lenses, none
of them a forecast - each one a weight on the three states above.
First lens - the differential, not the level. Yield minus inflation is the master
switch behind every asset I teach, and a currency runs on TWO of those switches at
once. What moves this chart is not one side's rate but the gap between the two real
rates and the direction that gap travels. When the gap grinds one way for years, you
get exactly what this chart shows: a wide box with a lean, and a market camped in the
lower third of it.
Second lens - the dollar side of every other chart. Gold, Bitcoin, crude, the Nasdaq
- each of those posts carried a dollar lens, and this pair is where that lens looks
back at you. A euro grinding up from the lower third is a soft-dollar statement that
feeds the gold bid, eases the pressure on crude, and loosens the collar on every risk
asset in the series. A euro breaking its floor says the opposite, loudly, to all of
them at once. One chart, many verdicts.
Third lens - gold and Bitcoin, the liquidity pair. When they bid together while the
euro firms off its lows, the combined message is dollar debasement, and the upward
rotation gains weight. When gold bids alone while the euro sinks toward the floor,
that is fear pricing, and the floor test gets closer on the calendar. Same two
references as every post in this series - the consistency is the method.
Fourth lens - the crowd at round numbers, held loosely. 1.1000, 1.2000, 1.3000: these
are not magic levels, they are coordination points where stops, options and headlines
cluster because humans love round numbers. That crowding is why fake breaks are the
signature move of old FX ranges - the fuel for the fade is parked just past the line.
I treat this lens as a prior about HOW walls break, never about WHETHER they do.
When the four lenses and my own panel lean the same way on the weekly, I trade it
with size. When they disagree, I take time instead. Time is a position too, and it is
the only one that never gets stopped out.
WHAT COUNTS AS AN OBSERVATION
A measurement is not a feeling, a headline, or a wick through a round number at three
in the morning. It is a close on the timeframe you named in advance. Everything else
is the market still in superposition - and you deciding to gamble on which way it
resolves.
So here is mine, in writing. Weekly closes that keep defending the lower third keep
me constructive toward the 1.2100 waypoint first, and only then toward the ceiling
conversation. A monthly close below 1.1000 ends this entire thesis - that is the
observation that collapses the post, and if it prints, I do not get to keep quoting
myself. A monthly close above 1.3000 ends the box the other way and rewrites every
dollar chart in this series at the same time. That is what an invalidation is for. It
is not pessimism - it is the price of being allowed to have a view at all.
WHAT COMES NEXT
This completes the first pass of the series I promised: gold, Bitcoin, crude oil,
Nasdaq, and now the euro - one instrument at a time, monthly thesis, weekly
permission, daily execution. From here the series updates itself: when one of the
named closes actually prints, the follow-up post reads that measurement. The charts
decide the publishing schedule, not me.
ONE HONEST NOTE ON THE FRAMING
Superposition, non-commuting measurements, entanglement - I use these as a thinking
tool, not as a claim that quantum physics moves price. I use them because they force
the two habits that actually pay: holding several outcomes at once instead of one,
and letting the measurement decide instead of me.
WHERE THE FREE MATERIAL IS
Nothing here is for sale, so I will just say where it lives.
YouTube: youtube.com/@HappyLittleTrades - free lecture playlists, in order
Telegram: t.me/HappyLittleTrades
Discord: discord.gg/rWRd8AyJ48
92 structured lessons across 11 languages, and live streams where any ticker
worldwide gets read on request. No paid tier, no signal group, no DM required.
If you think the floor breaks, or that the lower third is a gift, say so in the
comments with the close that would prove me wrong. That is a conversation worth
having. "It has to break out" is not - boxes bury that sentence for a living.