
XRP/USD — 1H Market Structure Analysis
🔎 Market Structure
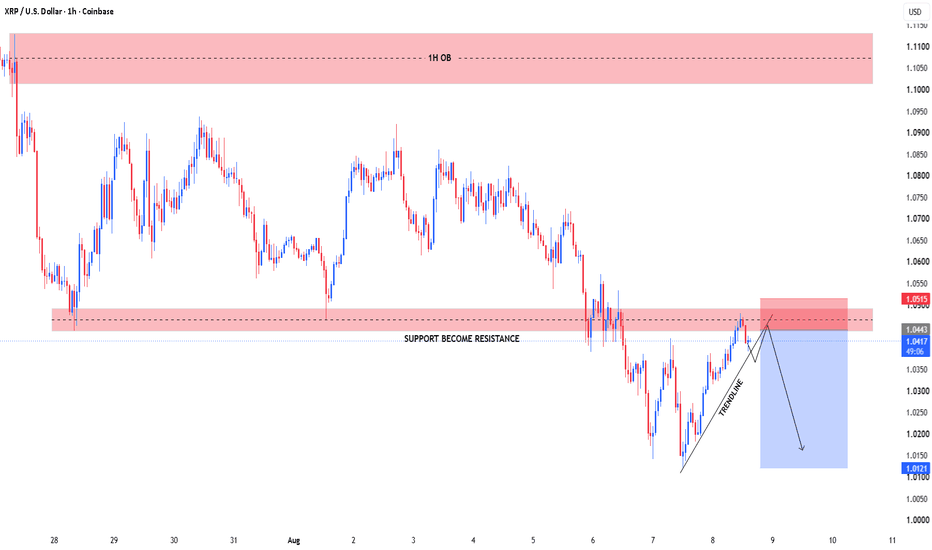
XRP/USD has been in a broader bearish structure on the chart, with price declining from the 1.08–1.09 area toward the 1.01–1.02 region.
The recent recovery has created a short-term ascending trendline and pushed price back into the previously important 1.042–1.052 resistance zone.
This makes the current area a key decision zone, rather than an automatic reversal point.
🟥 Support → Resistance Zone
~1.042–1.052
This zone previously acted as support and was later broken. Price is now retesting it from below/around the underside, making the reaction here important.
🟥 Higher-Timeframe 1H OB
~1.02–1.11 area as marked, with the key reference around 1.08
The upper 1H order-block region remains significantly above current price and can be treated as a higher resistance area if the market develops a sustained recovery.
🟢 Bullish Scenario
If XRP can achieve clear acceptance above 1.052 and maintain the reclaimed structure, the current bearish sequence could weaken.
The important confirmation would be a sustained breakout rather than a temporary wick through resistance.
🔴 Bearish Scenario
If price rejects the 1.042–1.052 zone and subsequently breaks the rising trendline, the short-term bullish recovery would be weakened.
The next areas to monitor would be:
1.02–1.03 — intermediate reaction area
1.012 — marked lower level on the chart
A move toward these areas would represent a deeper retracement rather than something that should be assumed in advance.
⚠️ Structure Invalidation
The bearish-rejection scenario becomes less convincing if price reclaims and holds above 1.052.
Likewise, the short-term bullish structure becomes weaker if the ascending trendline and recent higher-low sequence are decisively lost.
📝 TradingView-Ready Premium Description
XRPUSD 1H | Market Structure & Key Reaction Zone
XRP/USD remains within a broader bearish structure, while the latest price action has produced a short-term ascending recovery from the 1.01–1.02 area.
Price is now approaching the 1.042–1.052 zone, which previously acted as support before becoming resistance. The reaction around this area is therefore important for determining whether the recovery can continue or whether the broader bearish structure remains dominant.
Acceptance above the resistance zone could weaken the bearish structure, while rejection followed by a loss of the ascending trendline could expose lower reaction areas around 1.02–1.03 and 1.012.
This publication presents a scenario-based technical analysis using market structure, price action, support/resistance and trendline behavior. It is for informational purposes only; market conditions can change and no outcome is guaranteed.
#️⃣ Tags
#XRPUSD #XRP #Ripple #MarketStructure #PriceAction #TechnicalAnalysis #CryptoAnalysis #TradingView
