XAUUSD (Gold) H1 Analysis
**XAUUSD (Gold) H1 Analysis**
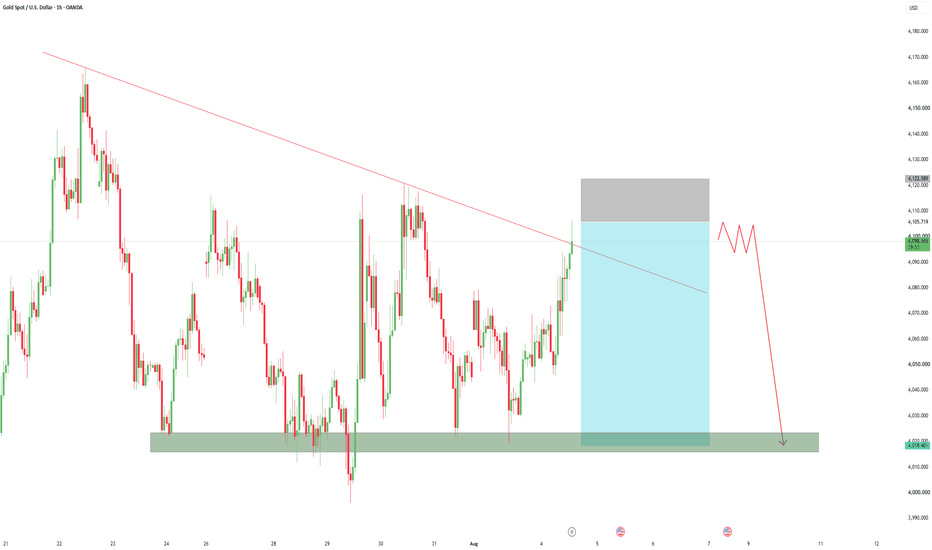
This chart suggests a **Sell** setup.
* Price has rallied into a **strong descending trendline**, which has acted as dynamic resistance.
* The current candle is testing the trendline around **4095–4100**.
* The gray zone above represents the **Stop Loss area**, meaning a breakout above it would invalidate the bearish idea.
* The blue risk/reward box shows the expected downside move.
* The green horizontal zone near **4018** is a major **support/demand zone** and the primary target.
* The red projection indicates that price may first move sideways (retest/rejection) before dropping toward the support area.
**Trade Idea**
* **Bias:** Sell
* **Entry:** Around **4095–4105** after bearish confirmation.
* **Stop Loss:** Above **4122**.
* **Take Profit:** **4018** support zone.
This setup remains valid **only if price stays below the descending trendline and fails to close above the resistance zone.**